


Ethereum is gradually heading for one of its biggest downtrends. During the previous week, it registered a massive decline in price.
It opened trading at $2,120. It had a bad start to the session as it dipped to as it lost almost 3%. It had a small pullback the next day but had very little impact on prices. During this period, the second largest coin maintained the $2k support.
This stopped on Wednesday as we noticed one of he biggest losses the coin experienced. It dipped to a low of $1,924. This signified a more than 8% decrease in value.
Two days later, it had another significant drop. It lost the $1,900 support. This time, it dipped to a low of $1,826 and closed with losses of almost 5%.
At the end of the week, the top altcoin registered a decline of 12%. Several indicators are bearish at this time, which are indications of further price decreases. Let’s go over them
Two Bearish Indicators
The first metric to consider is the Moving Average Convergence Divergence. It had a bearish divergence last week and is showing no signs of recovery.
The second is the Relative Strength Index. It opened the previous intraweek session at 68 and gradually dipped to a low of 45. This is a strong indication of the massive surge in buying volume.
Both indicators are pointing to more downtrends for Ethereum. How low will it go before recovery? The ETH Futures chart provides an answer to this question.
Ethereum May Retest $1,400
Traders rejoiced when they saw the top altcoin retest and flipped $2,100. However, the thrills were short-lived as ETH retraced during the next seven-day period.
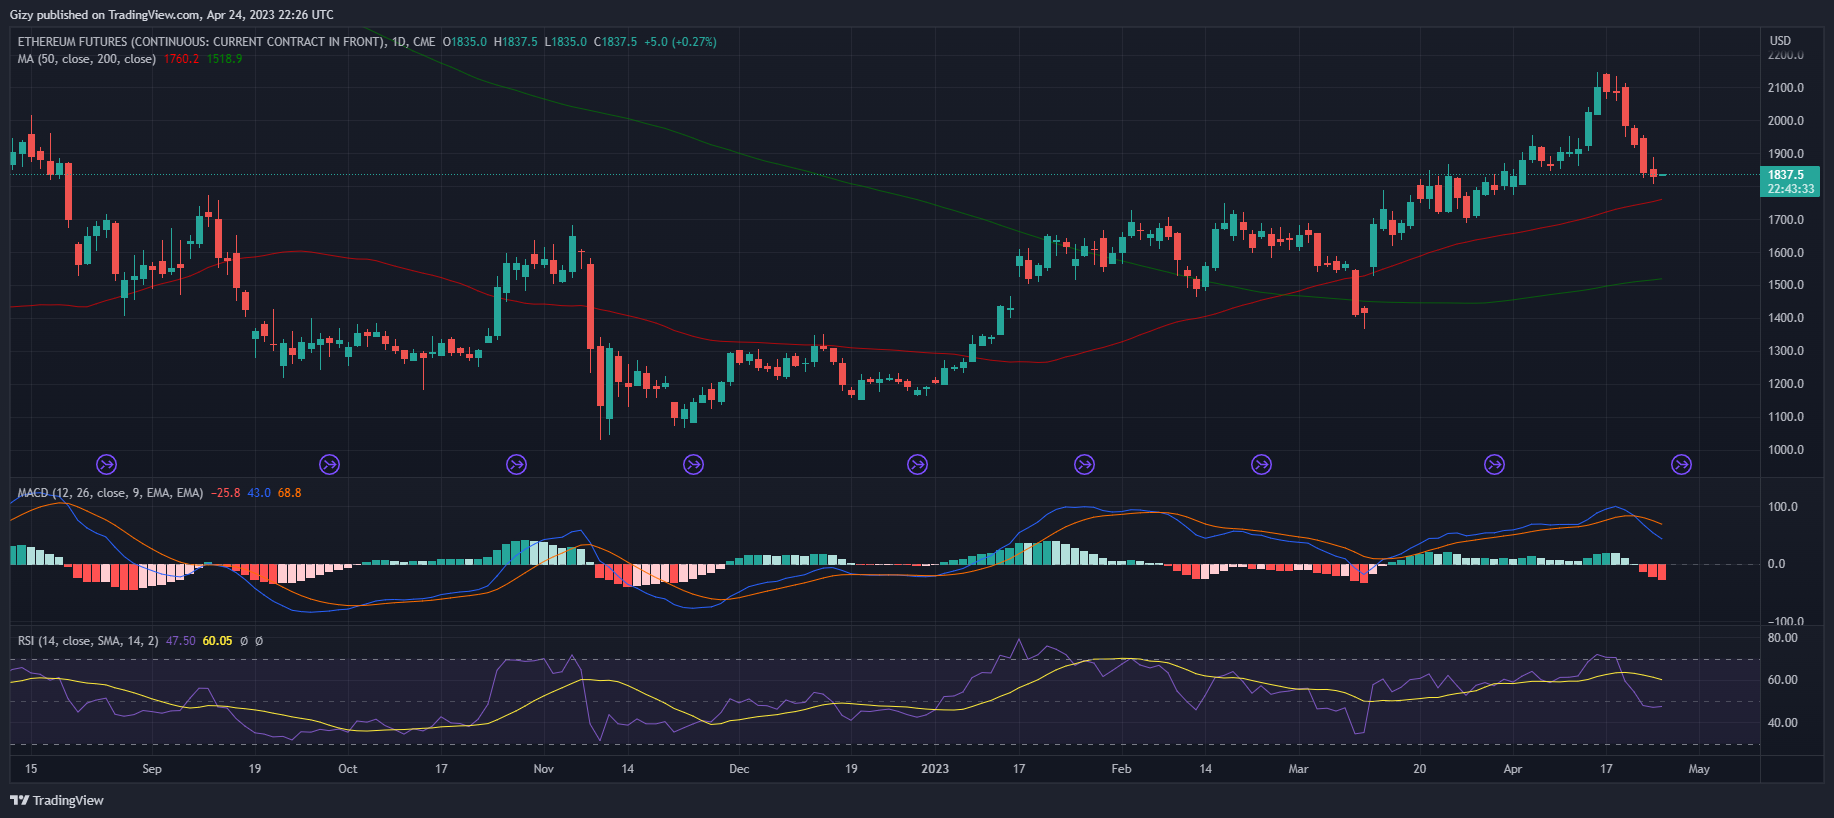
Ether CME chart indicates that we may see more decrease in the coin’s value. The image above shows that there is a huge CME gap between $1,500 and $1,400.
Nonetheless, before the major drop, we expect several pauses around key supports.