Solana Price Analysis August 22: Whale Activity Sparks Hope, But Will $170 Support Hold?
Solana (SOL) faces volatility as whale activity and technical indicators hint at recovery with a critical support level at $170.

Solana (SOL) has been grappling with volatility, struggling to maintain a price above the $150 mark.
Recent developments, including whale activity and technical indicators, suggest that Solana’s price may be entering a phase of potential recovery. A critical support level of $170 remains crucial for future price stability, especially in light of the recent market trends and significant token transfers.
Whale Activity Indicates Market Movement
On August 22, the on-chain analytics firm Lookonchain reported notable whale activity in the Solana market. Two major investors, identified by their wallet addresses “9tuA8L” and “7CsCGy,” collectively transferred 56,245 SOL, valued at approximately $8 million, from Binance.
The first account transferred 30,000 SOL, while the second transferred 26,245 SOL. This substantial transfer suggests that these investors are taking advantage of the current market conditions and possibly anticipating a more favorable price movement.
This whale activity aligns with data from Santiment, another analytics platform that monitors stablecoin holdings among large investors. The data reveals a pattern where increases in whale stablecoin holdings often coincide with rises in Solana’s price.
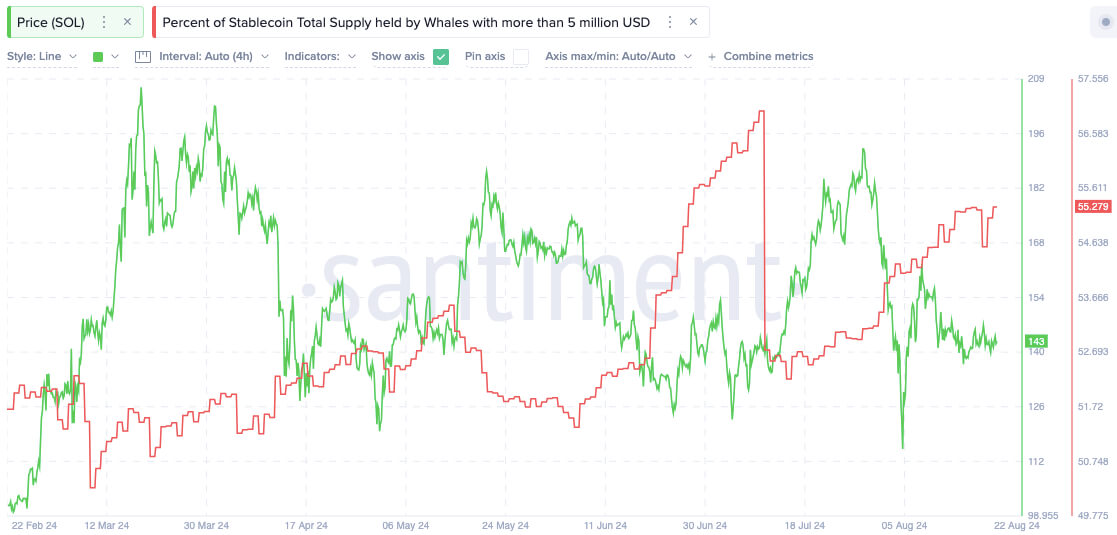
Source: Santiment
However, the recent uptick in stablecoin holdings has not yet resulted in an immediate price increase for Solana, which could indicate that whales are positioning themselves for future market transactions. This preparatory phase, marked by significant stablecoin activity, warrants close monitoring as it could signal upcoming market shifts.
Technical Indicators Reflect Cautious Optimism
The daily price chart of Solana on August 22 reflects significant intraday volatility. The price opened at around $142.75 and quickly dipped to a low near $140 in the early morning. Despite this initial decline, Solana’s price recovered, peaking at approximately $144 by early afternoon.
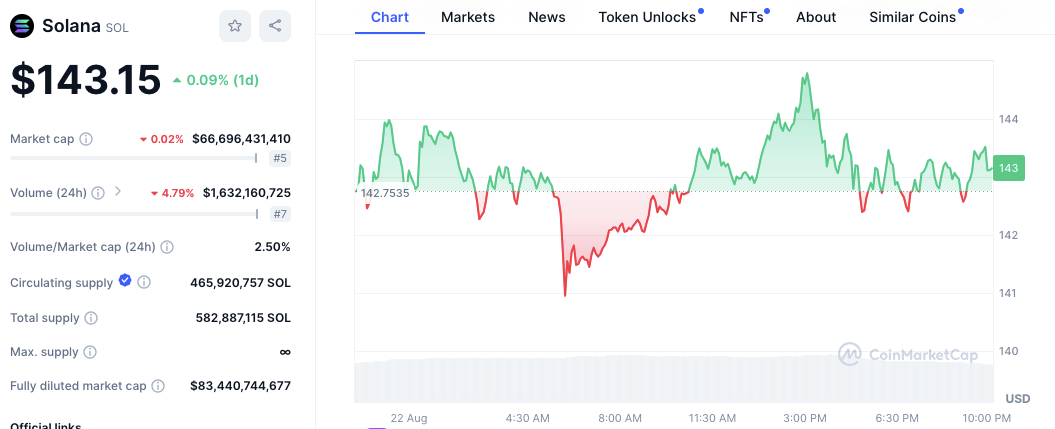
Source: CoinMarkrtCap
During the day the price oscillated between $141 and $144 and by the closing price it was at $143. Such fluctuations reflecting the continuous volatility in the market with the investor still holding some form of hope in future directions of the prices.
Moving on to the technical analysis, we can also see that the coefficients are ambivalent concerning Solana. Based on the MACD chart, one can see that the MACD line is below the signal line, which is an indication of bearish crossover, hence, there is a likelihood of price drop.
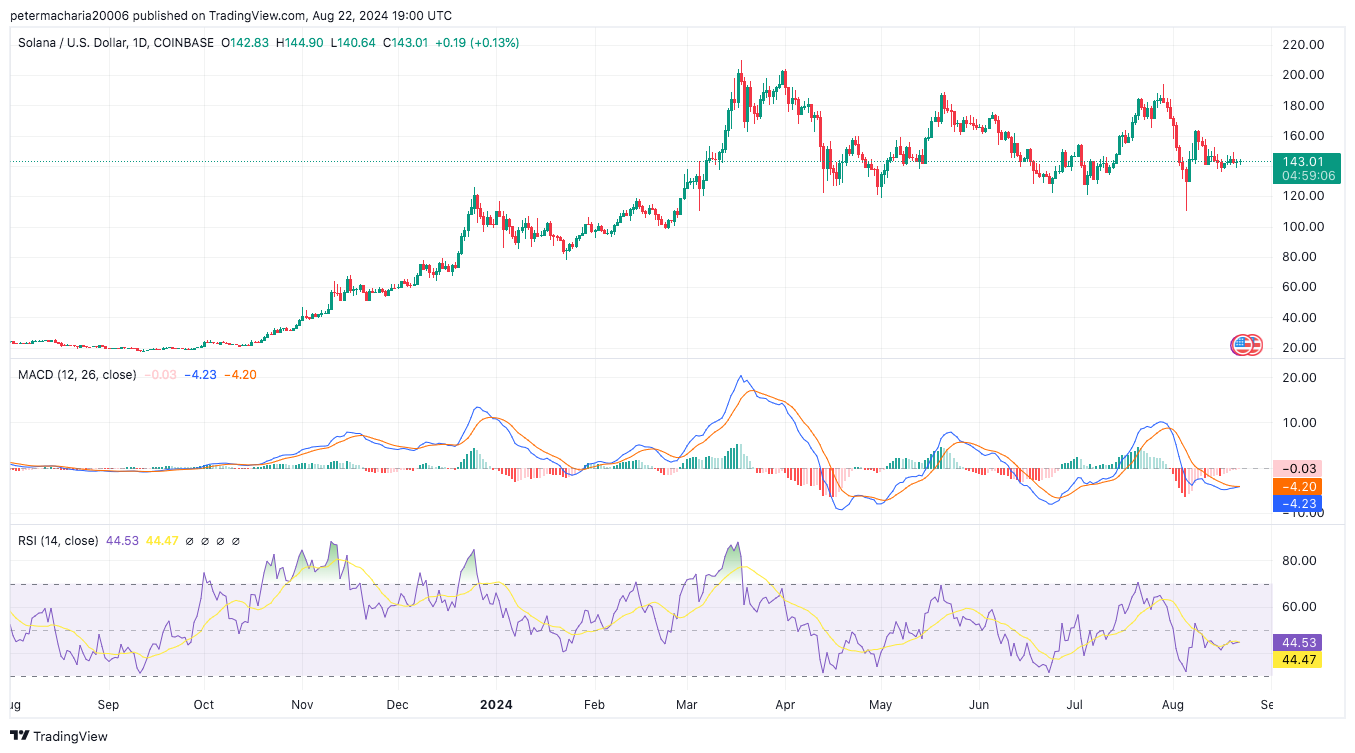
Source: TradingView
The histogram below supports this, having negative values that indicate a slowing down of the bullish pressure. On the other hand, using the Relative Strength Index (RSI), which stands at 44, makes Solana stagnate near the lower end of the neutral zone. However, if there is a positive change in the market, the proximity to the oversold could be an indication of a buying opportunity.
During these oscillations, $170 defines a crucial support line for staying in the long-term trend for Solana. It’s still a wild market despite the recent whale activity and other technical signals that showed signs of recovery. These are features that investors and analysts are keen to follow with the belief that Solana may experience a breakout should it go above $150 and move towards $170.
Follow us on Google News
Get the latest crypto insights and updates.
Related Posts

Tether USDT Market Cap Hits $160B Amid Stablecoin Surge
Hanan Zuhry
Author

Pump.fun Developer Jailed as Platform Hits $770M
Hanan Zuhry
Author

Binance Cybercrime Investigation Leads to $30M Bust in Brazil
Hanan Zuhry
Author