Chainlink Analysis: LINK Hits Its Highest Price Since July 2022. An Incoming ATH?
Chainlink prices over the weekend surprised many traders as the […]
 Why Trust Us


Chainlink prices over the weekend surprised many traders as the asset failed to register any huge gains or losses. However, prices started going berserk on Friday, with the trend extending to Sunday.
On the first day, the altcoin opened trading at $7.30 but dropped to a low of $7.26. It rebounded and was heading towards $8 but faced strong rejection $7.71. As a result, it dropped to a close at $7.57; gaining more than 3%.
Saturday was the most bullish as LINK broke through key barriers and held on to the gains. It retested the $7.50 support before rebounding and attempting the $8 support again. This time, the highlighted mark broke and the altcoin went further. For the first time since October 2022, the asset tried breaking the $9 barrier.
It briefly broke the said mark and peaked at $9.16 before retracing. As a result, it closed at $8.90. Nonetheless, this signifies a more than 17% increase in value.
On Sunday, the surge continued with aims at new barriers. The $10 resistance was next on the list. Following a small drop from its opening price, LINK continued forward and broke the highlighted mark, hitting a high of $10.2 and closing with gains exceeding 14%.
What Caused the Sudden Burst?
While there are no major announcements that could cause such price shifts, many may conclude that the most recent surge was induced by a small group of bulls attempting to pull the plug soon after. Others may conclude that this may be the start of an uptrend that may return LINK to its “past glory.”
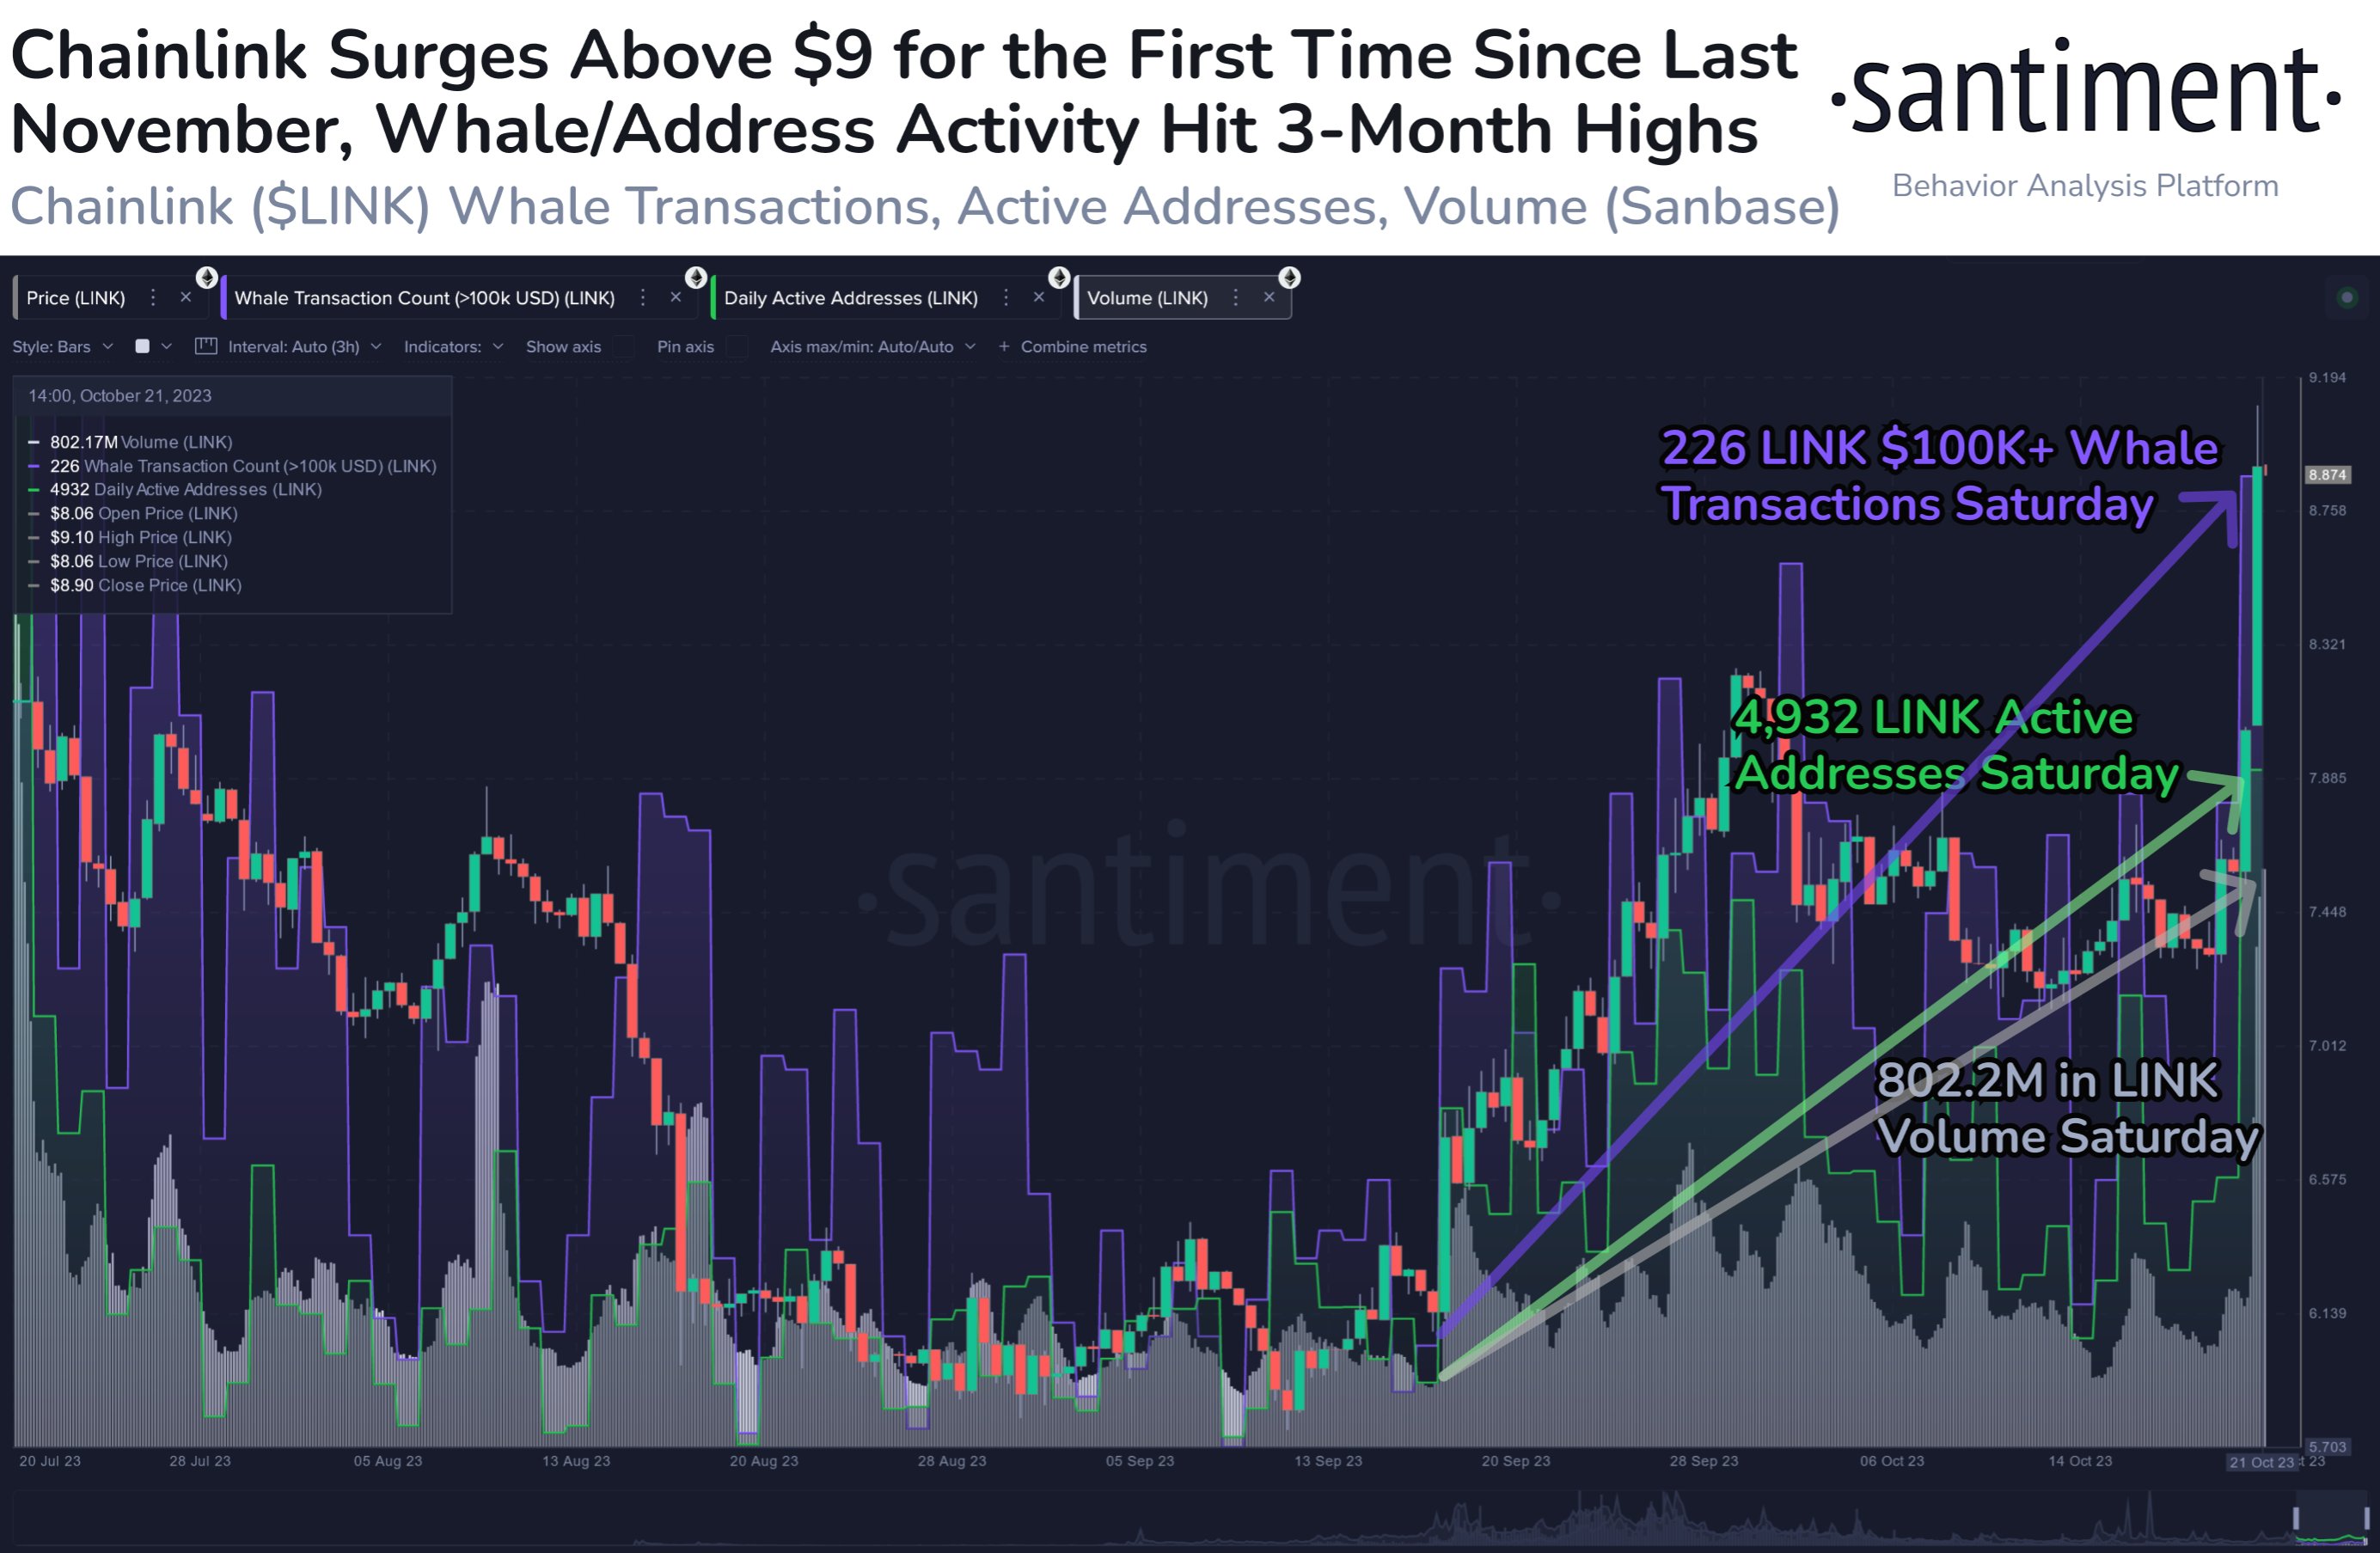
One account on X (formerly Twitter), Santiment shed more light on the recent hike in price. The chart above is the accompanying image that further explains what happened.
In what the account referred to as a “tear this weekend,” it stated that Chainlink network is seeing a massive increase in activity; the highest in the last three months. Whale transactions on the network reached a new high, so as its unique interacting addresses and trading volume.
The main catalyst for these actions was what the user referred to as “BTC redistribution.” This also explains the reason for the most recent surge in price. They also asserted that other altcoins also enjoyed this redistribution.
Chainlink Charts Show an Impending Downtrend
The question of wether the surges may continue is one that many look to know. It is important to note that the trigger for all the high was increased activity on the network. If the trend continues, so will the increases in price.
It is clear that such a feat is hard to come by. With this in mind, this is an indication that the asset may see moments of significant downtrend. One is imminent as the chart shows that the altcoin is currently struggling to hold prices.

It opened the current intraday session at $10.2 but retraced to a low of $9.80 before rebounding. It soon surged to retest $11 with brief success. Currently trading at $10, this explains all that happened after breaking the said barrier.
The Relative Strength Index shows that the present struggle may continue as the metric is at 80. This is above 70 which means chainlink is overbought. To return to normal, the altcoin must experience significant corrections which may send prices as low as $8.
Tags