XRP
As of March 26, 2026, Ripple (XRP) is trading at approximately 2.76 USD, reflecting a -4.99% decrease from the previous close.
| Current Price | 24h Price Change | 7-Day Avg Price | Support Level | Next Resistance |
| $2.76 USD | -4.99% | $3.15 USD | $0.403 USD | $3.60 USD |
📈 Technical Analysis Summary
- Price Movement: The -4.99% decrease indicates Bearish pressure; potential uncertainty or profit-taking.
- 7-Day Average Comparison: Trading below the 7-day average ($3.15 USD); weak or consolidating trend; watch for support breakdown.
- Support and Resistance Levels: Price is above support ($0.403 USD); confirms bullish base. Room for growth before hitting resistance ($3.60 USD).
- RSI Analysis: RSI at 57.83 indicates Neutral zone; balanced market.
- MACD Analysis: Negative MACD (-0.05); suggests bearish momentum.
📊 Market Sentiment
| Indicator | Value | Interpretation |
|---|---|---|
| RSI | 57.83% | Neutral; neither overbought nor oversold |
| MACD | -0.05 | Bearish; suggests downward momentum |
| Above 7-Day Avg? | No | Indicates bearish pressure or cooling off |
| Above Support? | Yes | Suggests price stability above support. |
Ripple Price Prediction Preview
| Forecast Range | Prediction Trend |
|---|---|
| Daily | 📉 Bearish — Caution in the short term due to weakening indicators |
| Weekly | 🔻 Weak — Risk of short-term pullback if support breaks |
| Monthly | 🚀 Bullish — XRPUSD could test $3.77 if momentum sustains |
| Yearly | 🌐 Long-Term Uptrend — Range between $3–$4 possible by year-end for XRPUSD |
Related News
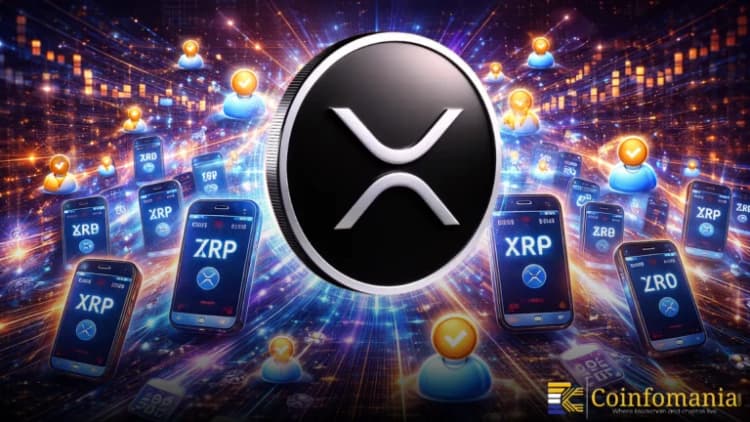
XRP Network Growth Surges as Wallets Hit 5.66M
The latest data from Santiment highlights a powerful shift within the XRP ecosystem. Wallet addresses holding under 100 XRP have reached a record 5.66 million. This milestone signals strong grassroots participation across the network. It also reflects growing confidence among smaller investors entering the space. XRP network growth now shows strength across all tiers, not […]
Vandit Grover
Author
XRP Enters Institutional Portfolios As Bitwise Signals Major Market Shift
Vandit Grover
Author
Ripple Report Shows Rising Institutional Crypto Demand
Hanan Zuhry
Author
XRP Treasury Firm Evernorth Files With SEC for Nasdaq Listing
Hanan Zuhry
Author
XRP Adoption Accelerates With Record Holders And Rising Network Activity
Vandit Grover
Author
XRP is a global finance system that operates on a decentralized network. While Ripple Labs plays a significant role in the XRP ecosystem, XRP itself is not governed by Ripple Labs. Instead, it runs on the open-source XRP Ledger (XRPL), which allows anybody to participate as a validator. This ledger is maintained by a distributed network of validators, including software engineers, operators, and businesses.
XRP is the native crypto of the XRP Ledger (XRPL). The space is led by the XRP community, which provides error-free functioning and low-cost transactions. This crypto was launched to overcome the limitations of traditional platforms, such as Bitcoin (BTC). XRP runs on peer-to-peer payment on XRPL, which is an innovative mechanism and also the powerhouse of this space.
XRP was launched in 2012 with a primary focus on cross-border payments, affordability, sustainability, and financial transfer hubs. XRP can currently process 1500 transactions seamlessly with an average ledger finality time of 3-5 seconds. With high performance and 63 million ledgers, it is trusted by many investors as a payment gateway.
In comparison to megacryptos like Ether (ETH), which takes 13 seconds, and Bitcoin (BTC), which takes around 10 minutes to bring finality, XRP is not only an affordable option but also a high-performance space. In addition, the XRP Ledger operates on the Ripple Protocol Consensus Algorithm (RPCA), allowing sustainability in this space.
Because of this approach, XRP can process transactions without requiring a lot of processing power or mining. Meanwhile, Bitcoin uses Proof-of-Work (PoW), which is less environmentally friendly than XRP and uses high computation power to operate as it requires mining that allows the Bitcoin transaction to officially enter into its blockchain. Bitcoin mining uses the energy equivalent of the whole country's energy consumption, and this makes XRP a more eco-friendly and sustainable option.
Investing in XRP
Is XRP a good investment option? The answer is yes! The good investor, or more specifically, the right time of investment, depends on various factors that involve market trends, adoption, regulatory developments, and its utility in cross-border payments. XRP, no doubt, is a surging coin, but it is also a highly fluctuating crypto, so it is on the investor to hunt the best entry point, which is usually during times of dips, which will be beneficial. Since the time of the XRP launch, the crypto was just $0.1. it has taken a long journey and is currently trading at $2.79 as of March 3, 2025, at the time of writing.
Investment Strategies & Best Practices
XRP has witnessed massive adoption and is backed by a robust community. It has utilities that are cross-border payment, instant finality, minimal gas fee, and secure space, making it a great investment option. If you are a trader looking to invest in this crypto, then keeping yourself updated with the latest market trends and news will be wise, as it will enhance your investment strategies.
You can also join community groups and dedicated coin spaces on social media to keep yourself updated with the latest developments. Do thorough research before making any investment, and start by monitoring breakout and rejection levels. Long-term investors should invest during drops, and it is also essential to always practice risk management when trading. Given XRP's role in global payments, it remains a strong long-term investment.
Long-Term Holding
According to Binance, if you are into long-term holding and believe that the XRP price will reach up to $3.5, the best strategy is to hold and accumulate. For long-term holding, it is better to avoid panic selling, as touching the $3.5 market requires patience and trust. Additionally, make sure to purchase the token during dips. Analysts note that for XRP to regain momentum and reach the $3 mark, it must break through key resistance levels at $2.51 and $2.72, which, as of March 3, 2025, did break this resistance. This means that XRP does offer capitalizing opportunities in the long term.
Holding rather than selling the crypto encourages institutional investors to enter the market, strengthening the XRP space. It is crucial to remember that XRP is backed by a robust community that shapes its future. By staying committed, holding through market fluctuations, and accumulating during dips, the community can collectively drive momentum. Every long-term investor contributes to XRP’s journey toward its true value.
Short-Term Holding
If you're a short-term investor, then constructing your strategy should involve a risk management factor. A short-term holder needs to be more active and monitor the market regularly to avoid losses. Because the crypto market is very unpredictable, highly fluctuating cryptos like XRP need to be vigilantly monitored. Make sure to pay attention to XRP breakout and rejection levels to gain an advantage. This will allow you, as a short-term investor, to hunt optimal entry and exit points to keep an upper hand on short-term price fluctuations.
The crypto market recently faced a tough time, as around $10 billion was wiped from the market due to hacking, resulting in uncertain market conditions. This has impacted crypto giants like XRP, leading to a massive drop. Adding to this, the shift in leadership at the SEC under President Trump sparked optimism and led to an even worst-case scenario, making the price fall by 24.6%. This made the XRP prices fluctuate between $2.32 and $2.50. So, in the short term, traders need to use risk management strategies to counter these market dips and uncertainty wisely.
Legal & Regulatory Considerations
Critics argue that XRP’s success depends heavily on Ripple because of its association with the company. Unlike Bitcoin (BTC) and Ethereum (ETH), which are fully decentralized, XRP’s ecosystem has been significantly shaped by Ripple’s business partnerships and promotional efforts. Still, it is also fueled by its robust community.
Considering the regulatory challenges caused by the Ripple legal battle with the SEC, this crypto has faced several challenges. But despite this ongoing legal battle and SEC challenges, XRP has continued its trajectory of growth with the help of a robust community, strategic tie-ups, and whale investments. However, U.S. regulators continue to debate whether XRP should be classified as a security until these regulatory issues are fully resolved.
How to Buy & Trade XRP
To buy XRP, you can visit cryptocurrency exchanges like Binance, Coinbase, Bitstamp, Kraken, Huobi Global, and ZebPay. Start by creating your free account on any of these platforms, then complete the formalities, such as identity verification and more. Then, choose the coin on the system and opt for the payment gateway of the respective platform. You can buy the crypto in the form of the base currency, USDT, and convert it to XRP.
And if you are looking for the best exchange to trade XRP among these crypto exchange spaces, then choose Binance because it is secure and user-friendly. The transaction fees depend on the platform you opted for. If it is Binance, then the transaction fees depend on your account level, which is based on your trading volume and BNB holdings.
Using BNB to pay trading fees can lower your costs. And if you are looking to trade on the XRP Ledger itself, the trading fees are as minimal as 0.00001 XRP, depending on network traffic. In an exchange space like Binance, the trading fees depend on your BNB holding and account level, and they differ for spot and margin trading, but the standard rate for traders is 0.1%. In futures trading, the commission fees will vary depending on several factors. Remember, each platform has different trading and transaction fees, which can be checked on the official site or apps.
How to Buy & Trade XRP
To buy XRP, you can visit cryptocurrency exchanges like Binance, Coinbase, Bitstamps, Kraken, Huobi Global, and ZebPay. Start by creating your free account on any of these platforms, then complete the formalities, such as identity verification and more. Then, choose the coin on the system and opt for the payment gateway of the respective platform. You can buy the crypto in the form of the base currency, USTD, and convert it to XRP.
And if you are looking for the best exchange to trade XRP among these crypto exchange spaces, then choose Binance because it is secure and user-friendly. The transaction fees depend on the platform you opt for. If it is Binance spaces, then the transaction fees depend on your account level, which is based on your trading volume and BNB holdings.
Using BNB to pay trading fees can lower your costs. And if you are looking to trade on the XRP ledger itself, the trading fees are as minimal as 0.00001 XRP, depending on network traffic. In an exchange space like Binance, the trading fees depend on your BNB holding and account level, and they differ for spot and margin trading, but the standard rate for traders is 0.1%. In future trading, the commission fees will vary depending on several factors. Remember, each platform has different trading and transaction fees, which can be checked on the official site or apps.
XRP Wallets & Security
Choosing the right wallet for your XRP holdings can be troublesome because of the number of wallet spaces. However, it is not an impossible task if you prefer your wallet based on these factors: its security, accessibility, and functionality. The best wallets that meet these requirements are Xaman (self-custody wallet) and Ledger Nano Series (hardware wallet), which we will explore below.
Xaman (Self-Custody Wallet)
Xaman, originally known as Xumm, is a self-custody wallet designed specifically for storing XRP. It allows users to manage multiple XRP accounts, ensuring that their assets stay safe and secure using passcodes or biometric authentication. Xaman also integrates with Tangem’s NFC hardware for enhanced security and is dedicated to the XRP Ledger.
Ledger Nano Series (Hardware Wallet)
Ledger Nano Series is a series of hardware wallets that has wallets like Nano S Plus and Nano X. These two wallets are dedicated to security and efficiency. This wallet is space for XRP holding because it stores the private key offline, which protects an individual from online threats and hacking in the crypto market. This wallet space supports over 5,500 coins and tokens that also include XRP, and it also has a Ledger Live app for easy management, so safeguarding your holdings with this wallet will not be a challenge.
How to Secure Your XRP Holdings
The best way to secure your XRP holdings is to keep them in a secure wallet, and when it comes to the secure wallet, what could be the better option than a hardware wallet like Ledger Nano? This wallet, as discussed, will keep your private keys safely offline, creating protection itself from online threats. Choosing a wallet wisely in today’s risky times of hacking, scams, and online phishing is important. Make sure that you enable two-step authentication, use a strong password, and back up your seed phrases offline. Be cautious of phishing scams and only download wallets from official and trusted sources.
Custodial vs Non-Custodial Wallets
There are several factors you can consider in choosing a custodial or non-custodial wallet for your XRP holding. Both of these wallets have unique offerings, so choosing the wallet that meets most of the requirements you have will be a great way to grab the best wallet. A custodial wallet offers you user-friendly space, but remember it is managed by a third party, which means it is a centralized space, and you need to trust a third-party provider for your private keys. On the other hand, non-custodial wallets allow you to be your own bank by giving you full control over your assets and offering you enhanced security, making them a great option if you are looking for long-term storage like Ledger Nano.
XRP Adoption & Use Cases
XRP has been adopted by many financial institutions and payment companies. To improve its cross-border payments, these institutions use Ripple's technology, with over 300 financial entities connected to its system, including BBVA, Banco Santander, UniCredit, and more.
In addition, Ripple has partnered with Amazon Web Services (AWS) to provide cloud-based infrastructure support. It has also collaborated with American Express, Banco Rendimento, and the Central Bank of Bhutan and Palau to enable faster, cheaper, and more efficient financial transactions compared to traditional payment systems.
Adoption in Global Markets
The regulatory framework and legal developments significantly influence the adoption of XRP. The ongoing resolution of legal cases, such as those before the SEC, has a profound impact. A favorable legal outcome may raise XRP’s adoption and increase confidence in the market.
Considering the global development scenarios, the approval of XRP Spot ETFs in regions like Brazil signals a growing acceptance of XRP as a legitimate investment asset. Meanwhile, political events and policy changes mainly related to crypto regulations also tend to influence major cryptos like XRP.
Innovations in the Ecosystem
XRP is a rapid and low-cost cross-border payment solution, which is one of the major reasons for its widespread adoption. XRP also has a strong community, and Ripple Labs continues to collaborate with financial institutions to bring innovation and new technology to the space.
In 2012, Ripple Labs launched the XRP Ledger and its native token, XRP, and created around 100 billion XRP, of which a large portion was dedicated to platform development and sustainability. Ripple Labs later enhanced its features and scalability, achieving 1,500 TPS while maintaining low energy consumption. This was made possible by the XRP Ledger's consensus mechanism, which does not rely on traditional mining but rather on a unique agreement-based validation system.
After several ongoing developments, in 2017, they took another major step: launching escrow-controlled token distribution to ensure market stability. Many users use XRP frequently for cross-border payments, and RippleNet enables frictionless international transactions for banks and financial organizations. XRP also plays an important function in finance, including trading and liquidity, and serves as a bridge currency.
Its connection with financial institutions and banking infrastructure is expected to accelerate adoption. The future of XRP is dependent on institutional collaborations, blockchain breakthroughs, and community acceptance, all of which affect its price.
Final Thoughts on XRP
XRP remains a cost-effective, efficient alternative to Bitcoin and Ethereum; since its launch, the crypto has grown a lot with new improvements and innovations. According to crypto analyst Steph, a recent discussion on XRP’s price revealed its potential under different market scenarios. XRP is a dominant crypto asset, holding about 4.6% of the market share with a current market cap of $153 billion as of March 3, 2025. If the market cap of this crypto reaches $10 trillion while maintaining its 4.6% dominance, then there is a possibility for XRP to touch $7.85.
But as you know, this crypto is highly volatile due to several market factors influencing it. It is better to invest in XRP by understanding the market trends, future potential, and associated risks. Some experts, according to Forbes, believe that XRP could reach $5 to $7 in the first half of 2025, driven by Ripple's technological advancements and increasing institutional adoption. XRP’s surge is only possible if the market conditions stay favorable towards XRP and the broader crypto ecosystem. Though it offers speed, scalability, institutional adoption, and energy efficiency, it also has challenges, such as regulatory uncertainty, concerns about centralization, and market volatility.
Are you concerned about whether this is the right time to invest in XRP? It is better to conduct thorough research based on these factors: market conditions, regulatory landscape, and risk tolerance. Based on these, make your investment strategy, choose a long-term or short-term investment option that suits you, and explore XRP-offered opportunities while considering the risks. Potential investors should conduct thorough research before investing.
XRP Price Prediction
XRP News
Frequently Asked Questions
What is XRP?
XRP coin is part of XRP Ledger which acts as a digital coin, created by Ripple Labs. It was built for the sole purpose of removing the traditional money transfer process with a high fee charge. XRP transfers money quickly, and easily, and takes 3-5 seconds to process transactions for cross-border payment. Additionally, it helps banks and businesses to transfer funds worldwide removing any middlemen and lengthy steps to processing.
How does the XRP Ledger differ from Bitcoin or Ethereum?
The XRP Ledger operates differently from Bitcoin and Ethereum. It employs a system where trusted computers verify transactions every 3–5 seconds. Unlike Bitcoin’s energy-intensive mining or Ethereum’s staking, it conserves power, processes 1,500 transactions per second, and focuses on payments rather than savings or apps.
Does any entity control XRP?
No entity controls XRP. It functions on the XRP Ledger, managed by over 150 independent computers globally. Changes require 80% agreement among them, preventing any single party, including Ripple Labs, from dominating. Ripple Labs operates one computer but lacks overall authority.
How does XRP come into existence, and can users mine it?
XRP does not involve mining. In 2012, creators generated 100 billion XRP tokens at once. Ripple Labs received 80 billion, with 55 billion held in reserve for gradual release. In XRP, every transaction is verified by computers ensuring XRP is fast and environmentally friendly without mining.
What relationship exists between XRP and Ripple Labs?
Ripple Labs is the creator of XRP. The primary purpose of which was to send money cross-borders at low fees, quickly and easily. XRP acts as the digital coin for the XRP ledger, and Ripple has no control over it. However, Ripple labs have the huge ownership of XRP coin, but they run on many independent computers.
How secure does the XRP Ledger remain?
The XRP Ledger maintains high security. Over 150 computers agree on each transaction to prevent fraud. Its open code allows the public to review and update, and a 10 XRP fee discourages fake accounts. Users must safeguard their secret codes to protect their funds.
Where can users purchase and store XRP?
Users or investors can buy XRP from platforms like Coinbase, Kraken, Binance, etc. The bought coins can be stored in the safe storing devices such as ledger or in wallets. What is important - to safeguard is the secret key or code to protect the coin.
Why does XRP excel for money transfers?
XRP completes transfers in 3–5 seconds with fees as low as $0.0002, outperforming banks and most digital currencies. It processes 1,500 transactions per second, easily converts between currencies, and minimizes environmental impact, making it ideal for global payments.
How has the SEC lawsuit impacted XRP?
In 2020, the SEC claimed Ripple Labs violated rules by selling XRP. A 2023 court ruled that XRP does not qualify as a special investment for public sales, boosting its price and prompting listings. Although the case may continue, XRP’s global use persists.
What potential does XRP hold for the future?
XRP holds potential for growth if banks adopt it for transfers, with Ripple’s payment tool active in 40 countries. New features like smart deals and digital collectibles could expand its role in online finance. Clear regulations and market shifts may help, but price swings pose risks.