


Solana has been on a spree since the start of the fourth quarter. Since the current three-month period started, the asset registered significant increases.
A good start took place in October. The coin opened that 30-day period at $21 but saw a gradual surge. As a result, it flipped several resistances. One such level was the $27 barrier. Over the last ten months, SOL tested the said mark more than twice. This happened during the first two months of 2023. It finally broke in two months.
The surge continued and the altcoin broke $35. It soon attempted the $40 barrier but failed as it peaked at $38. In the end, the alt closed with gains of almost 80%.
November was also filled with bullish moments as SOL continued its uptrend. During this period, it broke $50 and was heading toward $70. It hit a wall at $68 and retraced to a close at $59. In the end, the cryptocurrency closed with gains of more than 54%.
Currently exchanging at $77, the question on everyone’s mind is if the trend could send solana to $100 before the year runs out.
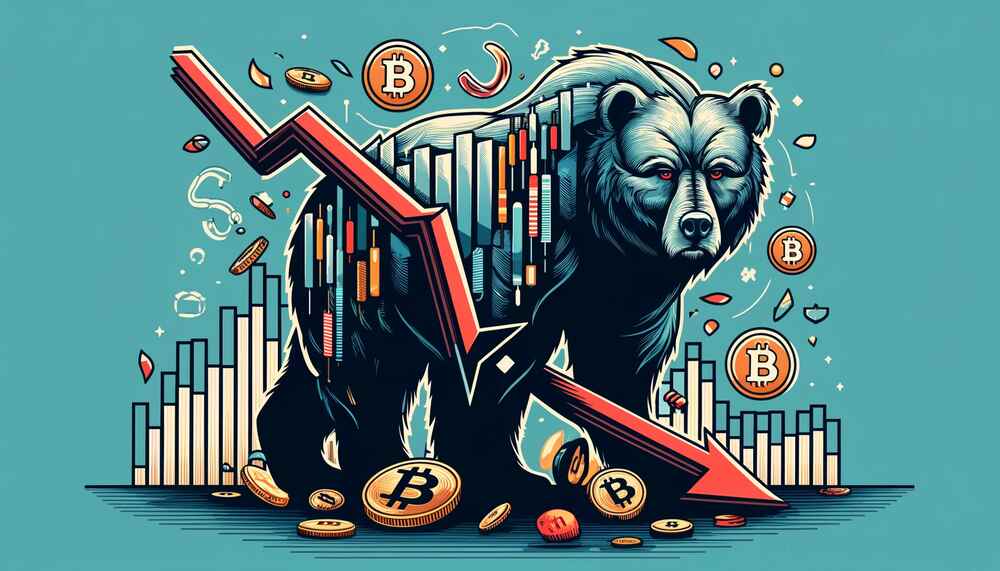
December is not Good for Solana
Since its introduction to the market in 2021, the coin has seen two Decembers. These two periods were some of the most bearish for the asset. For example, it lost 18% in 2021 and 22% in 2022. Will the current December be different?
The coin opened the current session on a more bullish note compared to the previous ones. For example, on the second day, it kicked off trading at $59 and peaked at $63 after a failed attempt at $64. Nonetheless, it closed with gains of more than 6%. After this single-day hike, it had three days of small decreases.
Two days ago, the asset resumed its uptrend. This time, it edged closer to flipping another key level. Following a flip of the $65 barrier at the start of the uptrend, it continued to gain momentum as it broke through the $75 resistance. However, it failed to gain stability above the mark as it is seeing a significant downtrend during the current intraday session.
A closer look at indicators following these notable increases places show a bullish trend in the market at this time. While it is important to note that SOL had a bullish start to the period under consideration, it is also important to note that December is generally bearish for the asset. With this in mind, the altcoin may make further attempts at resistance. However, $100 is less likely.
Key Levels to Watch
Critical Resistance: $80, $90, $100
Critical Support: $60, $50, $40
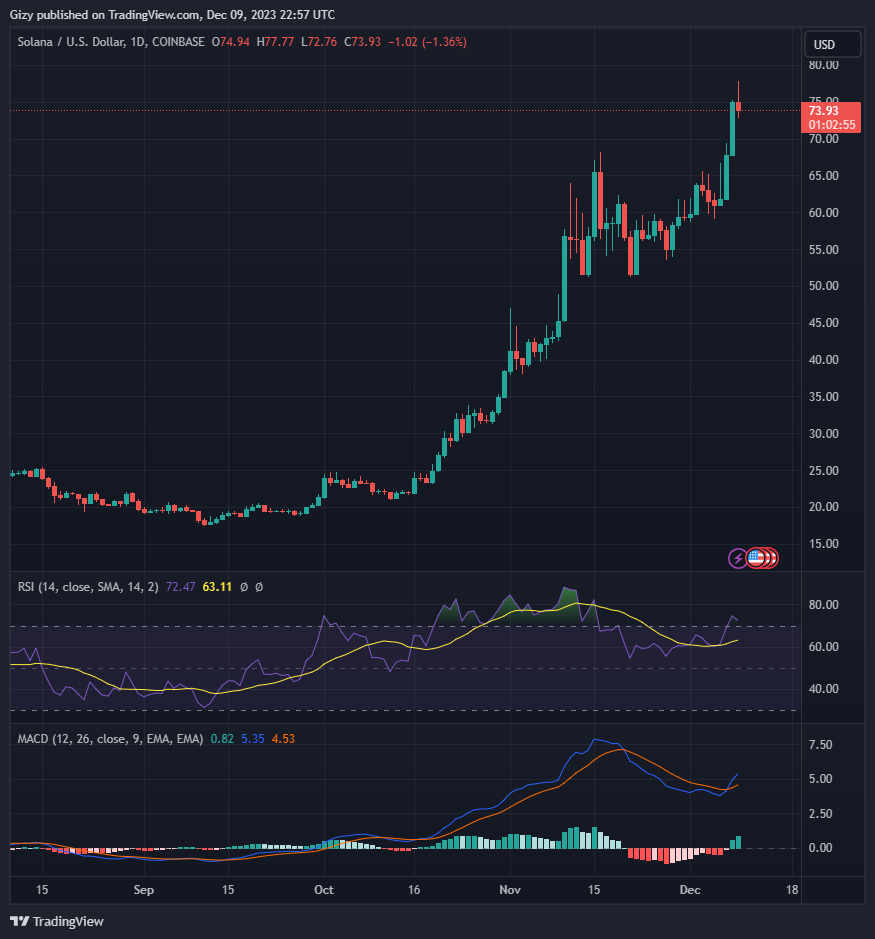
The Moving Average Convergence Divergence shows that solana just had a bullish divergence. The event carries promises of further price increases in coming days. With this in mind, let’s examine the barriers to the top. One such is the $80. The cryptocurrency under consideration hasn’t tested the said mark since May. The current high suggests it edging for a return.
Flipping the said may guarantee an attempt at $90. Based on the weekly chart, SOL may struggle to gain stability above it. However, previous price movement suggests that it’s not a tough one to break. After this, lyes the $100 resistance.
On the other hand, the alt may experience downtrends. One of the levels to watch is the $60 barrier. Once it flips, the asset may test $50. It is also worth noting that there is also a notable demand concentration at $55. Nonetheless, losing the said mark may cause a repeat of the previous bearish trends in the last month of the year.