Is Ripple Letting Developers Down? XRP Price Eyes 15% Crash
The Ripple native token, $XRP, has not been performing well in price, and inventors are beginning to worry if the drop will continue...

The Ripple native token, $XRP, has not been performing well in price, and inventors are beginning to worry if the drop will continue. The drop in the $XRP price is due to internal and external factors. First, the crypto market is not performing well, and second, there is a big disagreement within the Ripple community.
What is Happening to the XRP Price?
XRP started bleeding in price immediately after Bitcoin price fell below $57,000. In the crypto market, Bitcoin price movement often affects the direction of other cryptocurrencies. Its recent impact on $XRP is very severe, as the Ripples native token price fell below a critical support level.
The Ripple Community Issue
The Ripple ecosystem is currently undergoing a big disagreement. The argument is all about a “Sidechain” that the main developers on Ripple are planning to launch in 2025. In blockchain, a Sidechain is a smaller connected version of a mainchain. A Sidechain works alongside the main blockchain, and it can be built with special features or created to try new ideas. The primary purpose of a sidechain is to help the main blockchain scale.
In the XRP case, there has been ongoing development of a sidechain on the XRP Ledger mainchain called “Xahau.” The XRP Sidechain has a feature called “Hook,” similar to the function of smart contracts in Ethereum. Smart contracts are programs on a blockchain with the capabilities to execute actions when predefined conditions are met.
The new sidechain might be equipped with a feature similar to “Hook” on Xahua. The similarities in the functionality of Ripple’s new sidechain look like a threat to Xahau.
The Xahau developers express their displeasure over the move from Ripple, according to their lead developer, Wietse Wind. He feels the new Ripples’ sidechain is a replica of Xahau. In his open letter to the Ripple community on X, Wind believes Xahau is not just an idea but a real blockchain solution.
In response, Ripple’s CTO, David Schwartz, explained that Ripple has always been in touch with the Xahau team, and they’ve always supported their idea.
What’s Happening to The Price of $XRP Now
With the current conflict within the Ripple ecosystem and the overall bearish mood in the crypto market, the $XRP price has dropped in value by more than 3% in the past 24 hrs, and the token is currently trading at $0.5490.
Also, with the data coming from Coinglass, Traders are trading more short than long on $XRP. This means many crypto traders are speculating a bearish price movement for the token.
Can $XRP Price Drop Further?
Looking at the current $XRP price chart, we can see its market value is bearish. Using the MACD and RSI technical indicators to draw a support and resistance analysis, if $XRP goes below the $0.5386 support level, we might experience close to a 15% drop in price.
However, if $XRP changes direction and moves above the current resistance level of $0,568 is achieved. The Ripple native token might rise to $0.62 or more.
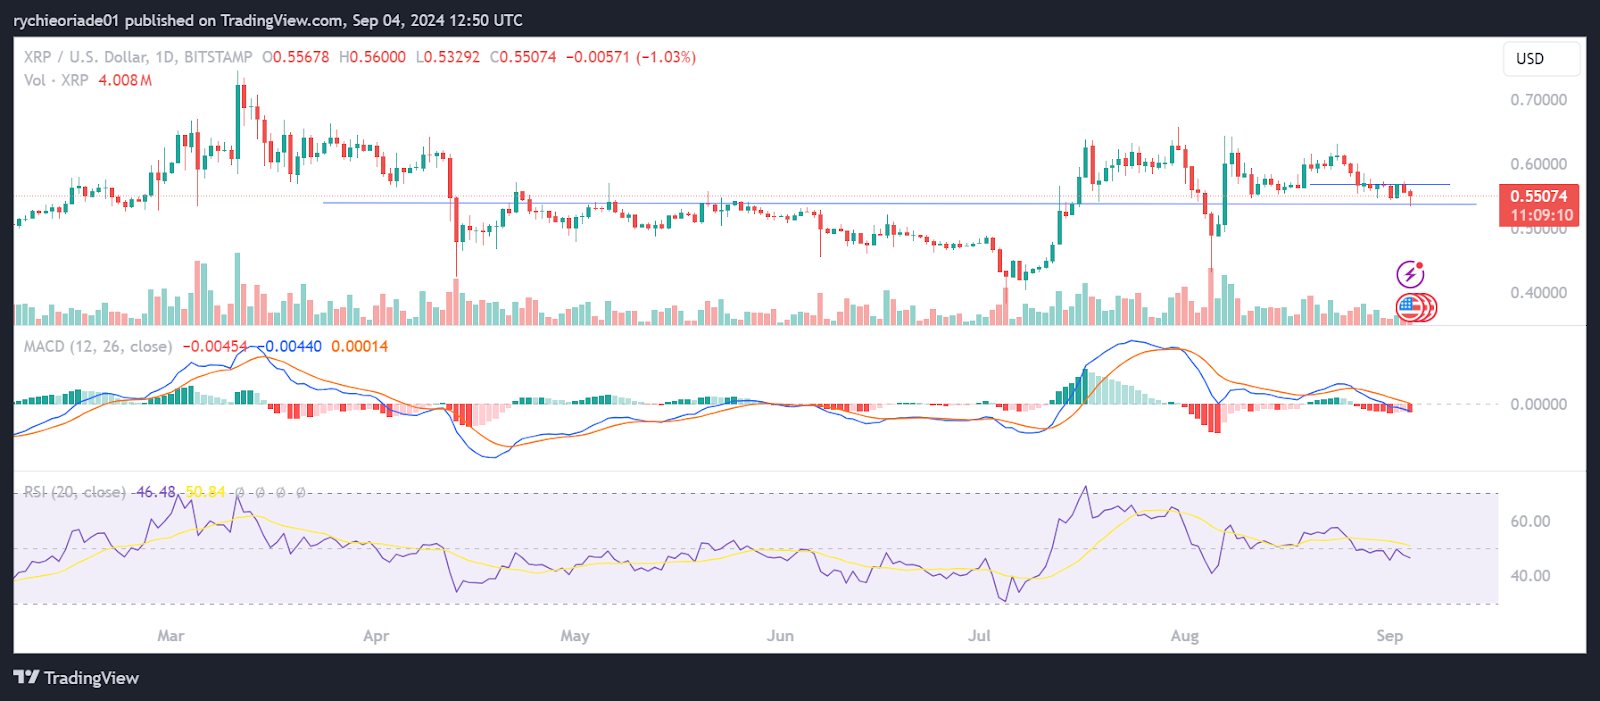
Source: TradingView
XRP Faces Bearish Pressure Amid Market Uncertainty
$XRP is currently going through a rough time as the general crypto market condition, and its internal conflict is really affecting its price. Some traders and crypto analysts are speculating a deeper bearish price movement for the token. However, it’s important to DYOR before investing in any crypto project and trade with caution.
Follow us on Google News
Get the latest crypto insights and updates.
Related Posts

Tether USDT Market Cap Hits $160B Amid Stablecoin Surge
Hanan Zuhry
Author

Pump.fun Developer Jailed as Platform Hits $770M
Hanan Zuhry
Author

Binance Cybercrime Investigation Leads to $30M Bust in Brazil
Hanan Zuhry
Author