Ripple (XRP) Price Prediction August 20th, 2024-2030: Can XRP Break the $1 Barrier Next Month with a 65% Surge?
Despite the recent crypto market downturn, XRP price demonstrated resilience with a relatively little drop and quick rejection...

Despite the recent crypto market downturn, XRP price demonstrated resilience with a relatively little drop and quick rejection, suggesting a potential bounceback. Can XRP defy the broader market sell-off and reach the $1 psychological level? Let’s examine the technical chart to assess the likelihood of XRP hitting $1.
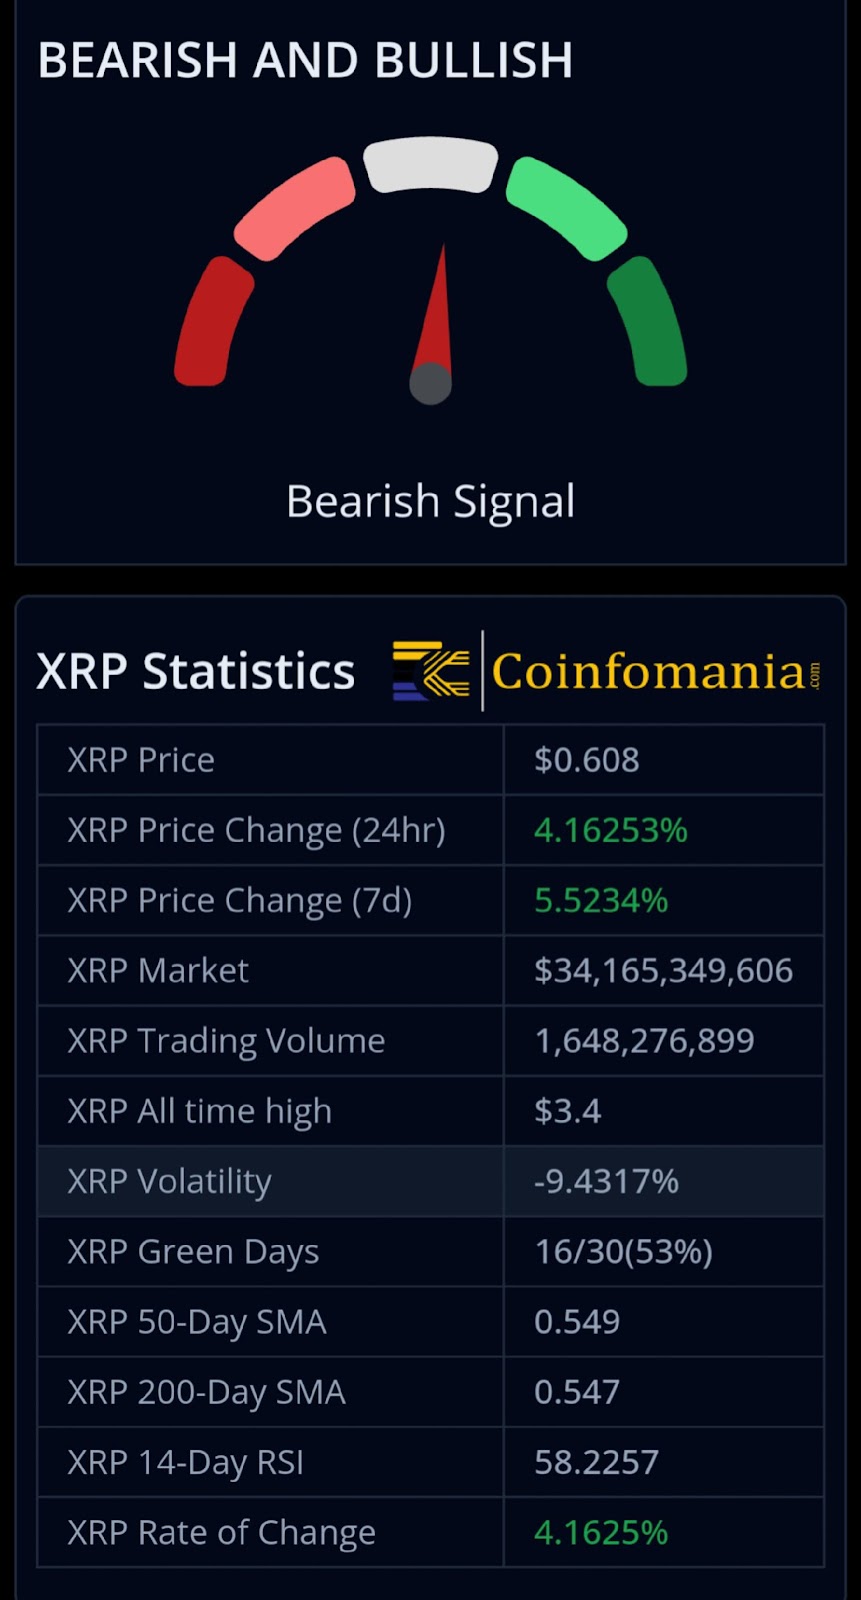
XRP is currently trading at $0.608, according to data from Coinfomania analytics, with a predicted 8.34% increase to $0.646 by August 27. Despite technical indicators suggesting a “Sell” market sentiment, XRP has shown a 53% positive trading trend over the last 30 days, with 16 out of 30 days experiencing gains. The coin’s price volatility is moderate, at -0.23%, and it has seen a 4.04% increase in the past 24 hours. The live market cap enjoys $34.16 billion.
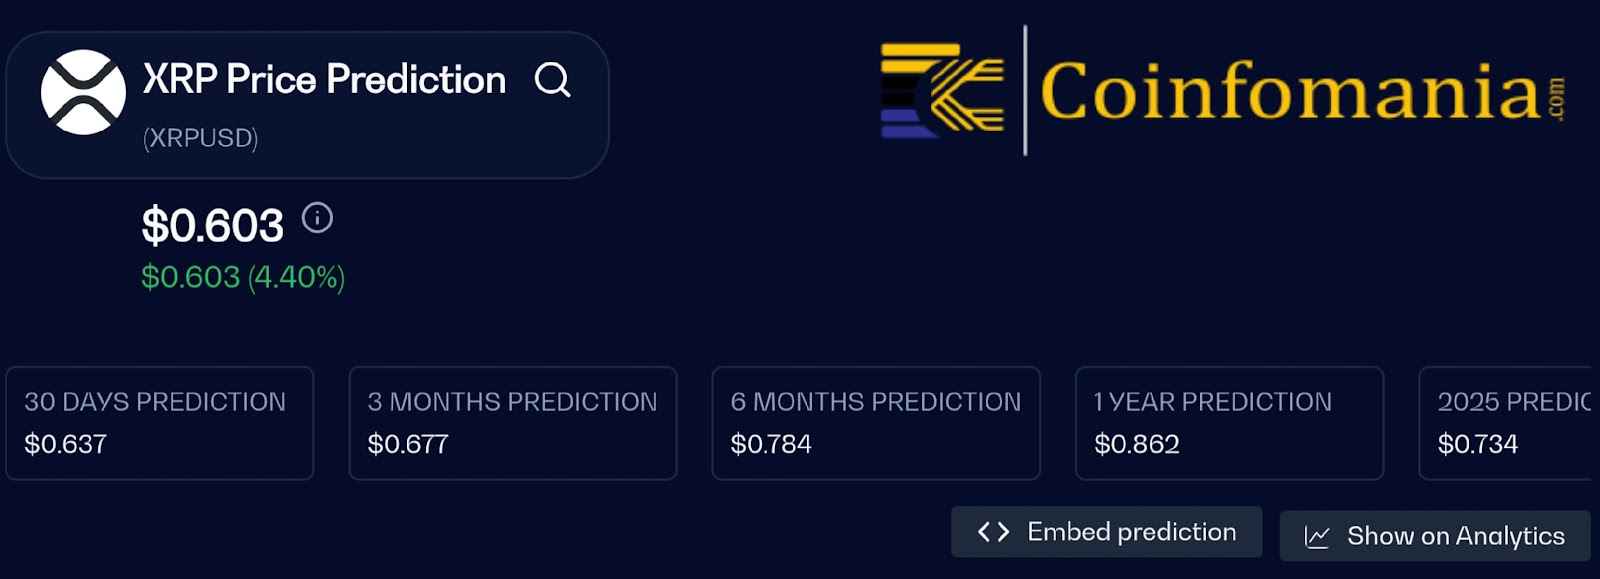
The 200-day SMA is predicted to eye $0.646 by August 27, 2024, while the 50-day SMA is expected to rev $0.55 by the same date. The Relative Strength Index (RSI) is at 56.72, indicating a neutral market sentiment for XRP.
A Big Recovery Earmarking Bullish Breakout
The daily chart reveals a robust recovery rally in progress, with XRP surging 7.14% in the last 24 hours, including a 2% intraday gain and a 6.29% increase overnight. This forms two consecutive bullish candles, completing a rounding-bottom reversal from the 50% Fibonacci level and 50D EMA at $0.54998.
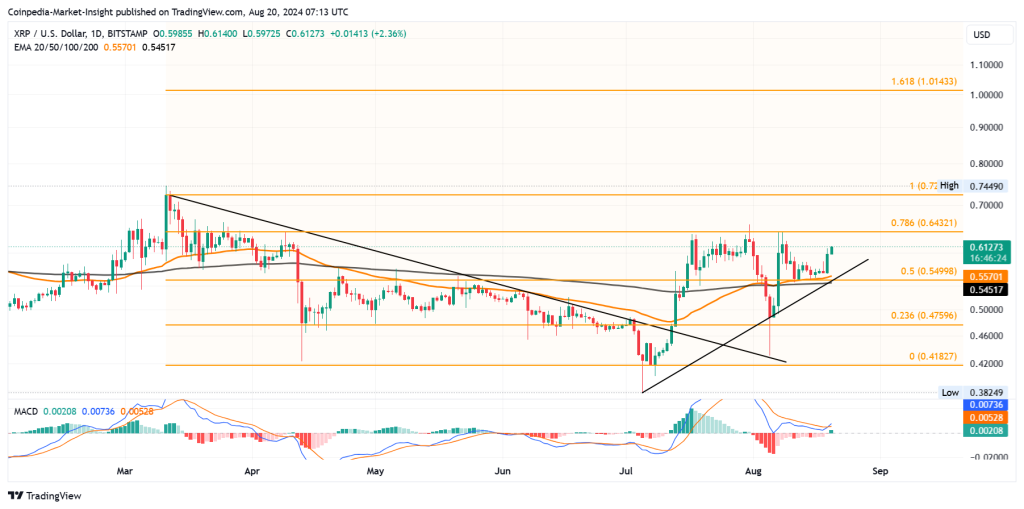
XRP/USD price chart. Source: TradingView
A trendline breakout in XRP marks the beginning of an uptrend, holding down a support trendline. In the interim, XRP’s price action forms an inverted head-and-shoulder pattern, with the neckline marrying the 78.60% Fibonacci level at $0.64321. As the recovery approaches this neckline, the likelihood of a bullish breakout increases. The golden crossover of the 50-day and 200-day EMAs reinforces the bullish trend, supporting a potential breakout. Furthermore, the MACD indicator shows a positive crossover, signaling growing bullish momentum.
For a short while, XRP continues to be one of the top stablecoins in the crypto world. The outlook for XRP price is positive in the next 30 days. The price is expected to remain stable at around $0.57. However, a breakout above the 78.60% Fibonacci level would open the door for a new 52-week high, potentially outdoing $0.72 and targeting the psychological $1 mark at the 1.618% Fibonacci level.
Long-Term Prediction: 2024-2030
Moving on, the future seems bright for XRP. By 2025, the price is predicted to hover around $1.02 on average, with an eyed high of $1.15. By 2026, the average price could rise to $1.58, with a desired upside of $1.75. The bullish trend continues into 2027, with the price signaling to sit at $2.38 and a $2.64 high. By 2030, the average price could cruise $8.32, with an upswing near $9.41.
Per a Coinfomania report, a handful of factors could influence the price of XRP, including — but not limited to — the outcome of the lawsuit between Ripple and the SEC. A positive and final outcome for Ripple could lead to a weighty price surge.
Follow us on Google News
Get the latest crypto insights and updates.
Related Posts

XRP ETF Outperformance Predicted by Canary Capital CEO
Hanan Zuhry
Author

TAC Mainnet Bridges Ethereum DeFi to Telegram’s 1 Billion Users
Hanan Zuhry
Author

The Blockchain Group Secures €6 Million to Boost Bitcoin Treasury Strategy
Hanan Zuhry
Author