Ripple Price Analysis of March 12, 2025: Will XRP Hold Above $2.1647 Support or Reverse After Breakout?
Let’s Dive into the Ripple Price Analysis of March 12 to understand XRP's market trends and investment potential in 2025.

Are you keeping an eye on the XRP price today and wondering what’s next? Ripple price analysis highlights notable price movements, including an upward channel, a breakout, and a potential pullback in the last 24 hours. Bulls are attempting to keep momentum, but resistance at higher levels remains a challenge. On the other hand, bearish signals lead to the possibility of a decline. As traders watch key price levels, the Ripple price prediction focuses on crucial support and resistance levels that could shape its next move. Will XRP maintain its gains, or is a correction on the horizon?
Ripple Sees Sharp Reversal After Oversold Conditions Trigger Uptrend
The trading day of March 11th began with a death cross, triggering a downward move that pushed XRP to support at $1.9000. The RSI showed an oversold condition, reinforcing the drop. However, at 1:25 UTC, a golden cross on the MACD line signaled an upward move, forming a spike that gained momentum. Further oversold RSI conditions at 4:15 UTC and 5:10 UTC helped fuel the price increase.
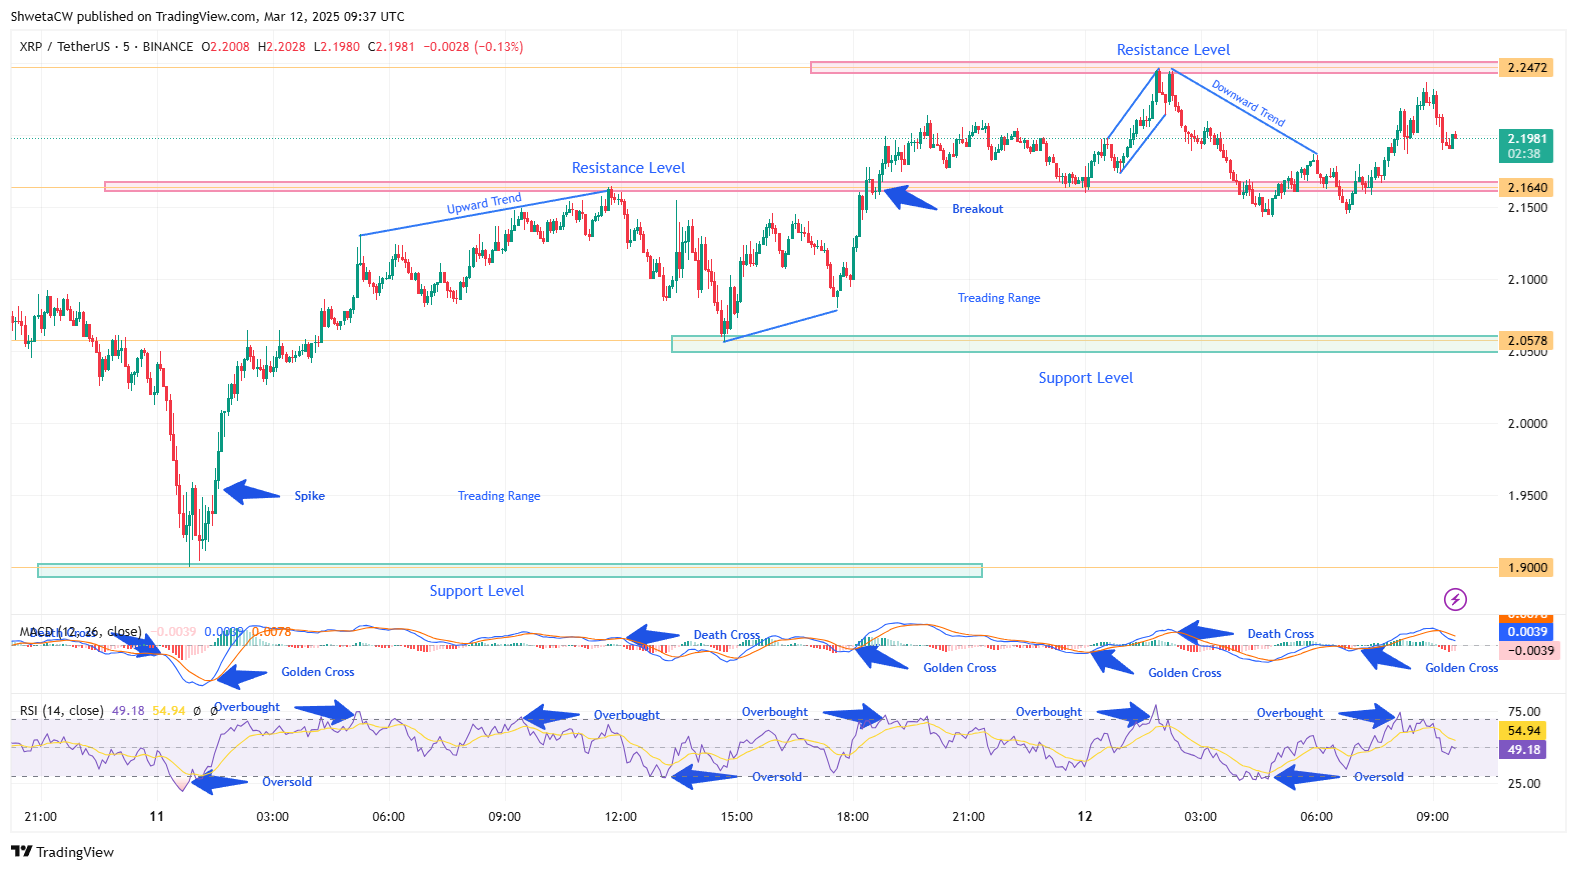
Chart 1, Analyzed by ShwetaCW, published on TradingView, March 12, 2025
By 9:25 UTC, another oversold situation led the price to test resistance at $2.1647. A death cross at 12:05 UTC then initiated another drop, bringing XRP to $2.0559 support after an oversold RSI signal at 13:10 UTC. At 18:00 UTC, a golden cross on the MACD triggered an upward breakout, pushing XRP beyond resistance into a new trading range. However, a death cross at 19:55 UTC signaled another downtrend, driving the price toward its new support, previously a resistance level.
False Breakdown Reversed as XRP Enters New Trading Range
The trading day of March 12th began with a golden cross on the MACD, signaling an upward move. However, an overbought condition at 1:50 UTC led the price to hit resistance at $2.2465. A death cross at 2:20 UTC initiated a downward trend, pushing the price lower. Continuous oversold conditions from 4:00 to 4:40 UTC caused a potential breakdown as the price tested support. However, a golden cross at 4:55 UTC reversed the move, confirming the breakdown as false. The price struggled at support until another golden cross at 7:05 UTC suggested an upward trend, leading XRP into a new trading range.
Ripple Market Prediction
Ripple price analysis shows that the XRP price today has an upward channel, a breakout, and a recovery. If the upward trend continues, Ripple price prediction suggests that it could test the key resistance at $2.2465. However, if bearish pressure takes over, the price could decline toward the support at $2.1647, which was the previous resistance. Traders should watch for potential breakouts or breakdowns as XRP navigates its new trading range. The next moves will depend on market sentiment and upcoming technical signals.
Follow us on Google News
Get the latest crypto insights and updates.
Related Posts

BitMEX Founder Arthur Hayes Says U.S. Treasury Is Steering Bitcoin Market Gains
Mikaeel
Author

B² Network and Nibiru Partner to Bring Native Bitcoin Liquidity to Cosmos DeFi
Deepika Kapparapu
Author

Bitcoin’s $106K Whiplash Triggers Market Sentiment Shift as Ethereum and Altcoins Rebound
Triparna Baishnab
Author
Loading more news...