


Ethereum is one of the many assets that got hit by a little negative fundamental. Over the last 24 hours, one of the news stories relating to it that made the rounds was that of Donald Trump. The former United States President relinquished his bet on the asset as reports have it that he sold $2.4 million worth of the asset in the last three weeks.
Following the announcement, ETH barely reacted in price as it traded flat on most exchanges. However, trading conditions at the time of writing are quite tougher than the previous day’s. It started the day at $2,345 but made attempts at reclaiming $2,400. It high showed that it failed in its bid. Nonetheless, it dropped to a low of $2,257.
Currently exchanging at $2,287, the asset is recovering from its low. However, it is yet to fully erase the losses it had as it’s still down by almost 3%. The question on every trader’s mind at this time is whether the trend will continue. The chart offers a glimpse into what the next price action may be.
In other news, the largest altcoin is gradually losing “fans” around the world. A recent report on Google Insight highlighted the fact that Ether’s rival Solana got more searches than it did. The changes happened in countries like Spain and the Philippines.
Let’s see what the charts say
Ethereum Had a Bearish Convergence
During the previous intraday, the largest altcoin raised hope after reclaiming $2,400. As a result, the 12-day EMA in the Moving Average Convergence Divergence intercepted its counterpart. The most recent trend ensured a reversal.
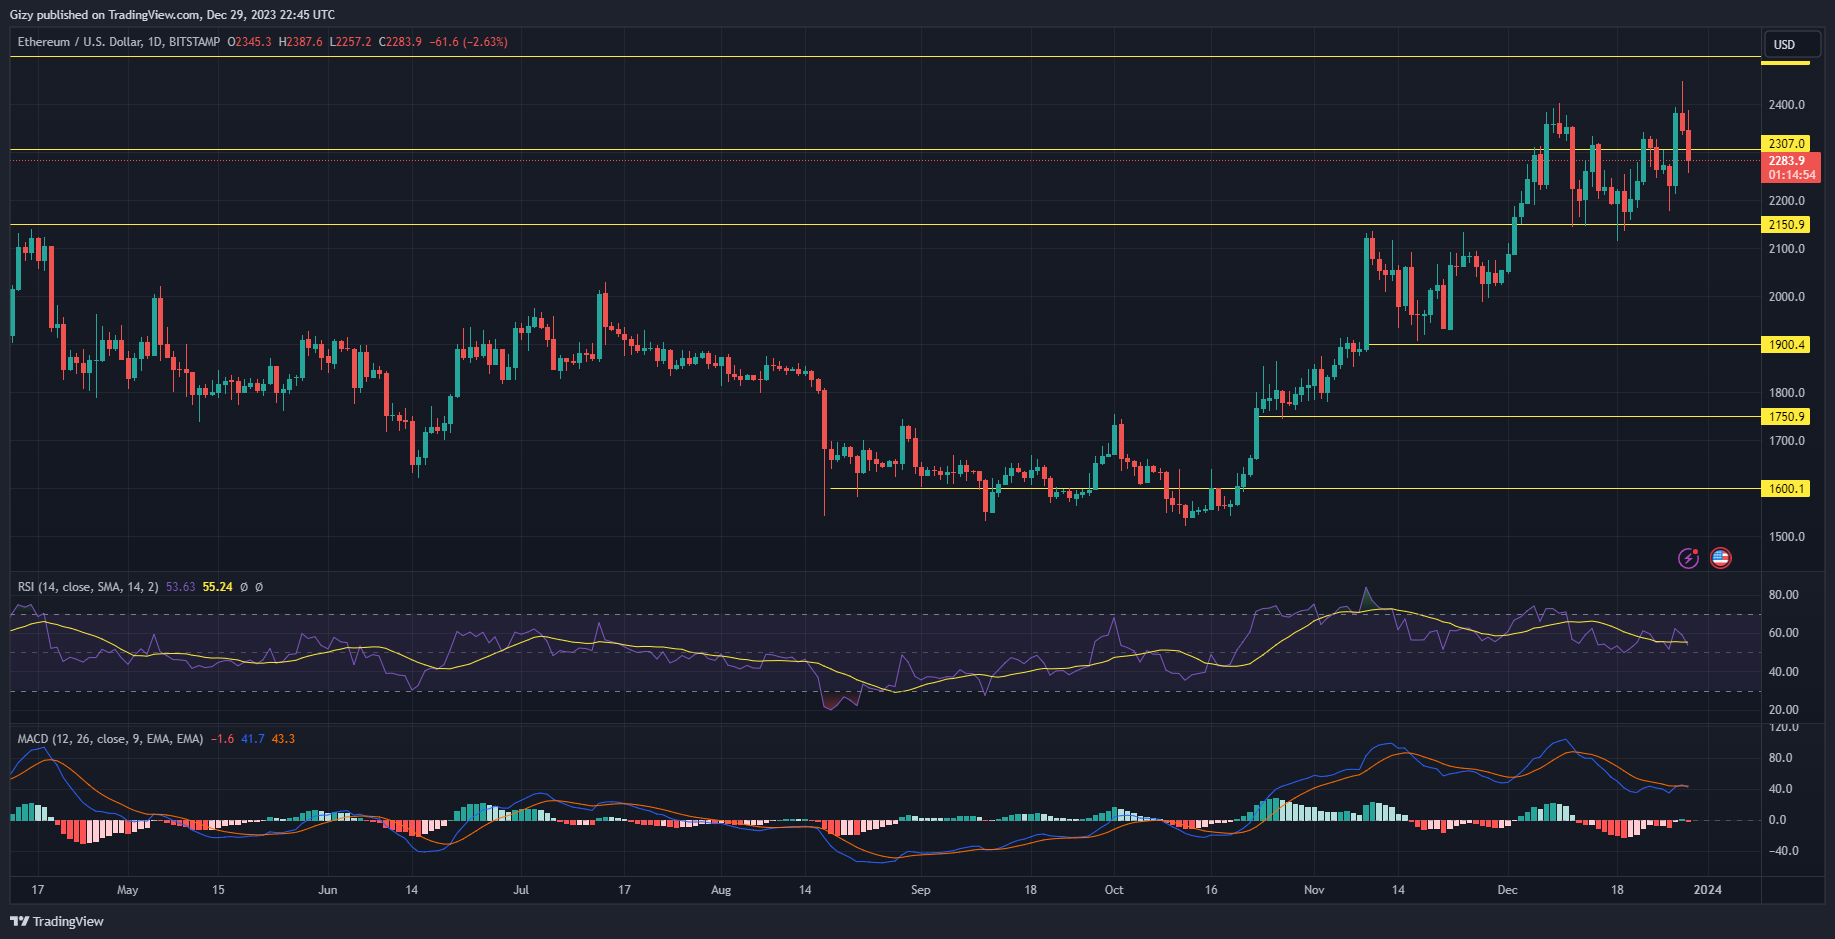
A closer look at the chart above clearly shows the bearish divergence taking place. With this reading in mind, many may expect a considerable decrease in price in the coming days. It is also worth noting that the Relative Strength Index is also seeing small downtrends at this time. It’s at 53.
In the Coming Days
Ethereum may continue its struggle around its current value. Nonetheless, $2,228, it’s a clear sign of the asset veering close to a critical level; the $2,150. This is one of the most important mark as if it breaks, the largest altcoin may sink below $2k. A closer look at the mark revealed its strength as it held out against several attempts.
Although very unlikely due to the reduced volatility, ETH and other cryptocurrencies are having, the said level might break. If this happens, the alt may continue to freefall until it finds another support at $1,900.
On the other hand, if market conditions change, ethereum may aim for resistance. One of the closest to the current price is the $2,400. Based on previous price movements, the said saw more than two major attempts with one success. During the most recent trial, it peaked at $2,447 but failed to gain stability above it retraced.
However, with volatility on the low, the asset may be unable to achieve this bid. If that happens, the next level to watch is the $2,500. Based on the weekly chart, this one of the critical marks. Nonetheless, it’s not as tough as the $2,400.