


FLR starts the current week with good news. During the previous intraday session, the project announced that Google Cloud just became one of its validators. The move continues to highlight the widespread crypto adoption and acceptance in today’s world. In response, the coin had a massive surge.
However, this barely had any impact on the global cryptocurrency market cap. A closer look at the chart shows valuation in an almost straight line over the last 48 hours. While this shows a lack of volatility, the movement during the previous intraweek session was more wavy than this.
It started that period at $1.62 trillion but rose to a peak of $1.67 trillion during the second day. Returning to its opening price later, it recovered and closed at $1.64 trillion. However, this showed that the market failed to register any gains during that session. This may also be the same pattern unfolding this week.
Nonetheless, the last seven days provided top gainers and losers. JUP lost more than 67% despite recent listing by major exchanges. It is safe to conclude that most investors took profit and left the asset to plummet. BONK also had significant losses during this period. It lost more than 12% and is continuing its downtrend during the present session.
Following price actions across several cryptocurrencies, questions about how they’ll perform this week are inevitable.
Top Three Cryptocurrencies to Watch
BTC/USD
Bitcoin’s performance during the previous week was filled with reduced volatility. The weekly charts perfectly depict this as a very small candle representing that session. Nonetheless, the asset tried testing a critical level that is yet to crack.
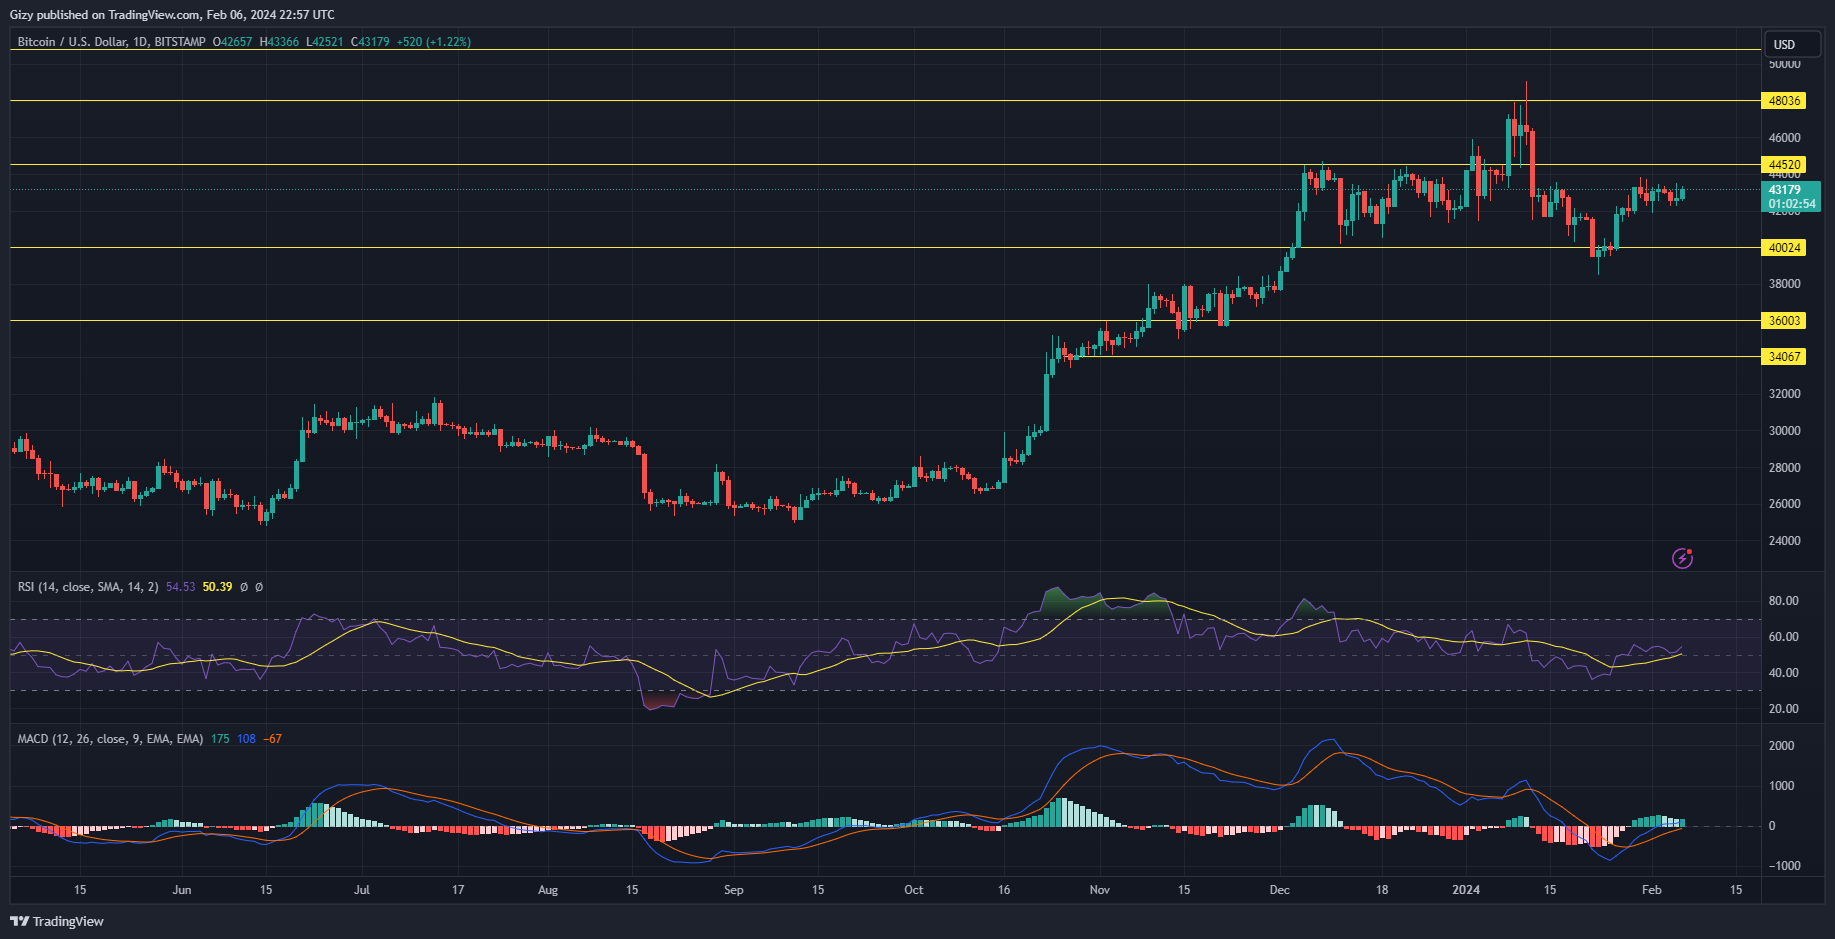
This happened on Monday as the top coin had its biggest hike. It opened trading at $42k but dropped to a low of $41,800 before the rebound. Afterward, many expected it to retest the $44k resistance but it failed to do so as it faced strong rejections at $43,300. Further attempts took place during the next intraday session as it edged closer to the said mark. It hit a high of $43,853.
The new week is looking like a continuation of the previous one. There almost no change in value during the previous intraday session. This is further depicted as a doji with one of the tiniest bodies. Although the current day is different in terms of price movement, the apex has not recorded any significant changes in prices. However, it attained a high of $43,300 which is almost $200 lower than the previous day’s.
Nonetheless, a closer look at indicators shows improving trading conditions that did not reflect on prices. For example, the Moving Average Convergence Divergence is continuing its uptrend. Before now, the 12-day EMA was approaching a close that could spell downtrends for the asset. It experienced a change in trajectory and is back on an uptrend.
If the pattern as the previous week play out, BTC may briefly flip $44k but continue trading below it for most of the next five days. Additionally, it is worth noting that with the decline in volatility, bitcoin may not slip below $42k, continuing the previous trend.
ENS/USD
Ethereum Name Service had a volatility-filled performance during the previous intraweek session. It opened at $18.8 and closed with losses of more than 3%. A closer look at the chart reveals a long wick sticking out of the candle representing price action during that period.

One of the main highlights took place on Monday. The token retested the $20 resistance following its opening. It had small success as it peaked at $20.1 before closing below it. Nonetheless, it registered gains of more than 7%. It went further during the next intraday session as it attained a high of $20.6. However, it retraced and dropped to a low of $18.6 before rebounding.
With a focus on the new week, ENS is off to a good start. It started the previous intraday session at $17.8 and surged after a brief price decline. It broke $20 again and peaked at $20.5. It soon retraced and closed above the said mark, representing a more than 12% increase in values.
The same bullish trend is ongoing at the time of writing. The token is seeing significant changes in value as it broke another critical resistance. It went past $22 and recorded a high of $22.8 as its bid for $23 halted. Currently up by more than 10%, the asset may continue its uptrend.
The Moving Average Convergence Divergence showed that ENS had a bullish divergence. If trading conditions remain the same ENS may retest $25.
FLR/USD
Flare had a splendid performance during the previous week. It experienced significant surges that saw it break several resistances and attain levels it hadn’t in almost a year. The uptrend was buoyed by reports of massive activity in the flare network.

One of the key highlights of the session happened on Friday. It opened trading at $0.022 and immediately started an uptrend. As a result, it broke its six-month high at $0.024. It also went through the $0.026 and peaked at $0.0262. Although it had a small price decline, it closed with gains of more than 17%.
The asset is unable to sustain the uptrend as the last 40 hours showed notable price declines. A look at Sunday’s shades light on the reason for the most recent price decrease. FLR had its biggest surge during this period, gaining more than 16%. It is evident that traders are taking profit already, hence the drop in value.
If the current bearish trend continues, the altcoin may drop as low as $0.024 as there is no strong support before this mark. However, the asset may also create new ones.