TRUMP Price Analysis for March 12, 2025: Can TRUMP Break Past the $10.93 Resistance Today?
Let's understand the Trump price analysis of March 12, 2025, and explore the Trump price trend and whether to invest or not.
Author by
News Room

TRUMP’s price trend is volatile because the values stop falling below $9.56 and cannot break above $10.91. Current market behavior indicates traders should stay cautious since TRUMP presents a similar price movement in the trading range. The market is uncertain because a bearish MACD crossover and RSI oversold conditions indicate sell signals. The current price movements need deeper analysis to reveal if TRUMP will discover market support or whether more price declines await investors; the question remains: Will TRUMP find new support or a further decline ahead? Let’s do the Trump price analysis.
TRUMP Keeps Fluctuating in the Trading Range – March 12, 2025
TRUMP started the trading session with a strong breakout at 00:05 UTC, redirected the trend movement as oversold conditions increased the buying pressure on the traders and hit the support level at $9.54. A golden cross at 01:20 UTC on the MACD indicator, which softly pushed the price from $9.54, gave TRUMP a positive start to the day and let it move upward until $11 resistance held it back in the trading range.
Soon after, an overbought situation at 06:10 UTC appeared, sending TRUMP on a downtrend that ended at a breakout, and an oversold situation at 13:05 UTC. Another breakout occurred at 14:10 UTC, indicating a potential trend reversal. At 14:45 UTC, a doji candle appeared with an oversold situation, as indicated by the RSI indicator, reversing the trade pattern.
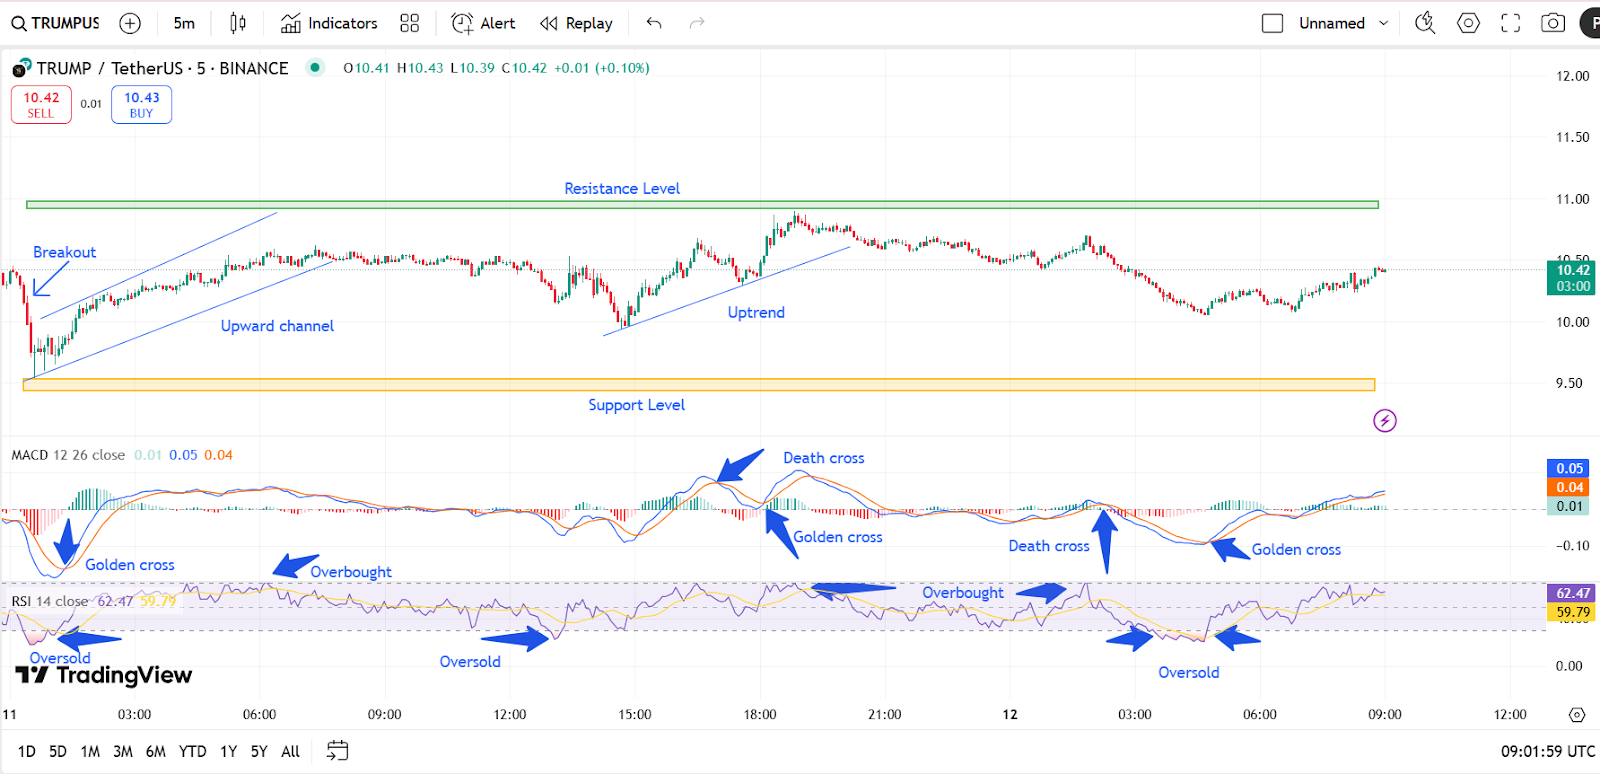
Based on Trump price analysis, the market took another turn when a new golden cross appeared at 15:05 UTC, causing the price to rise again in upward momentum and raising the prospect of hitting the $11 resistance level. However, a death cross at 17:00 UTC caused the rise to $10.47. A golden crossover at 18:05 UTC and the RSI indicated overbought circumstances, suggesting an imminent pullback, which caused the increase in the trend pattern. This movement continued until the next day, showcasing overbought situations and simultaneously crosses, making the trump price trend remain volatile.
TRUMP Price Analysis for March 12: What Indicators Suggest?
TRUMP started its trading day with a downtrend directory. Price decreased due to the expanding selling pressure, which activated the MACD death cross at 02:15 UTC. A brief trump price trend occurred after the death cross, following oversold conditions at 03:40 UTC and 04:40 UTC, causing the price to maintain its downward movement throughout the channel until a golden cross hit the trump price today at 04:45 UTC, giving hope to the traders. The overall recovery from this event moved very slowly. The price is now moving at $10.33.
TRUMP Price Today: A Look Into the Future
Trump’s recent market movements show signs that its ongoing fluctuation is nearing its end. The price might start a bullish trend when it surpasses the $10.92 resistance level. Traders must observe RSI combined with MACD readings to validate upcoming market changes. A price movement above resistance levels might boost its value, whereas a support level breakdown could extend the negative price trend. The future price of TRUMP depends on current market emotions, while broader cryptocurrency movements will determine its direction significantly.

News Room
Editor
Related Posts

Crypto Industry Reacts to Donald Trump’s Influence as SEC Task Force Meets with Trump-Affiliated Firms
News Room
Editor

Solana NFT Ecosystem Booms as Mad Lads Leads a New Wave of Activity
News Room
Editor

Crypto News: Shiba Inu Burn Rate Spikes 1,361% — Can SHIB Break $0.00001411 and Sustain the Rally?
News Room
Editor
Loading more news...