TRON Price Analysis of March 11, 2025: TRON Fluctuated between $0.2380 and $0.2260, Could It Hold the Support Level?
Let's dive into TRON price analysis and explore the potential support and resistance level for TRON price today
Author by
Coinfomania News Room

If you are tracking TRON and wondering how long this short-term downtrend might continue, then you are at the right place. As we go through price analysis, we explore different patterns and how the price trend reacted to them and determine potential support and resistance levels for TRON. TRON shows bearish sentiment with some bullish momentum in the early hours. Without any further delay, let’s dive into TRON price analysis and determine where TRON price today could trade.
TRON Price Analysis of the Last 24 Hours
At 00:40 UTC, TRON broke out to the upside from a downward-moving channel, corroborated by a golden cross in MACD. The price formed a spike and a converging triangle pattern, which further broke out to the upside at 02:10 UTC and formed a spike and range pattern. At 02:35 UTC, RSI moved above the level of 70, indicating an overbought market condition, suggesting a reversal or a pullback.
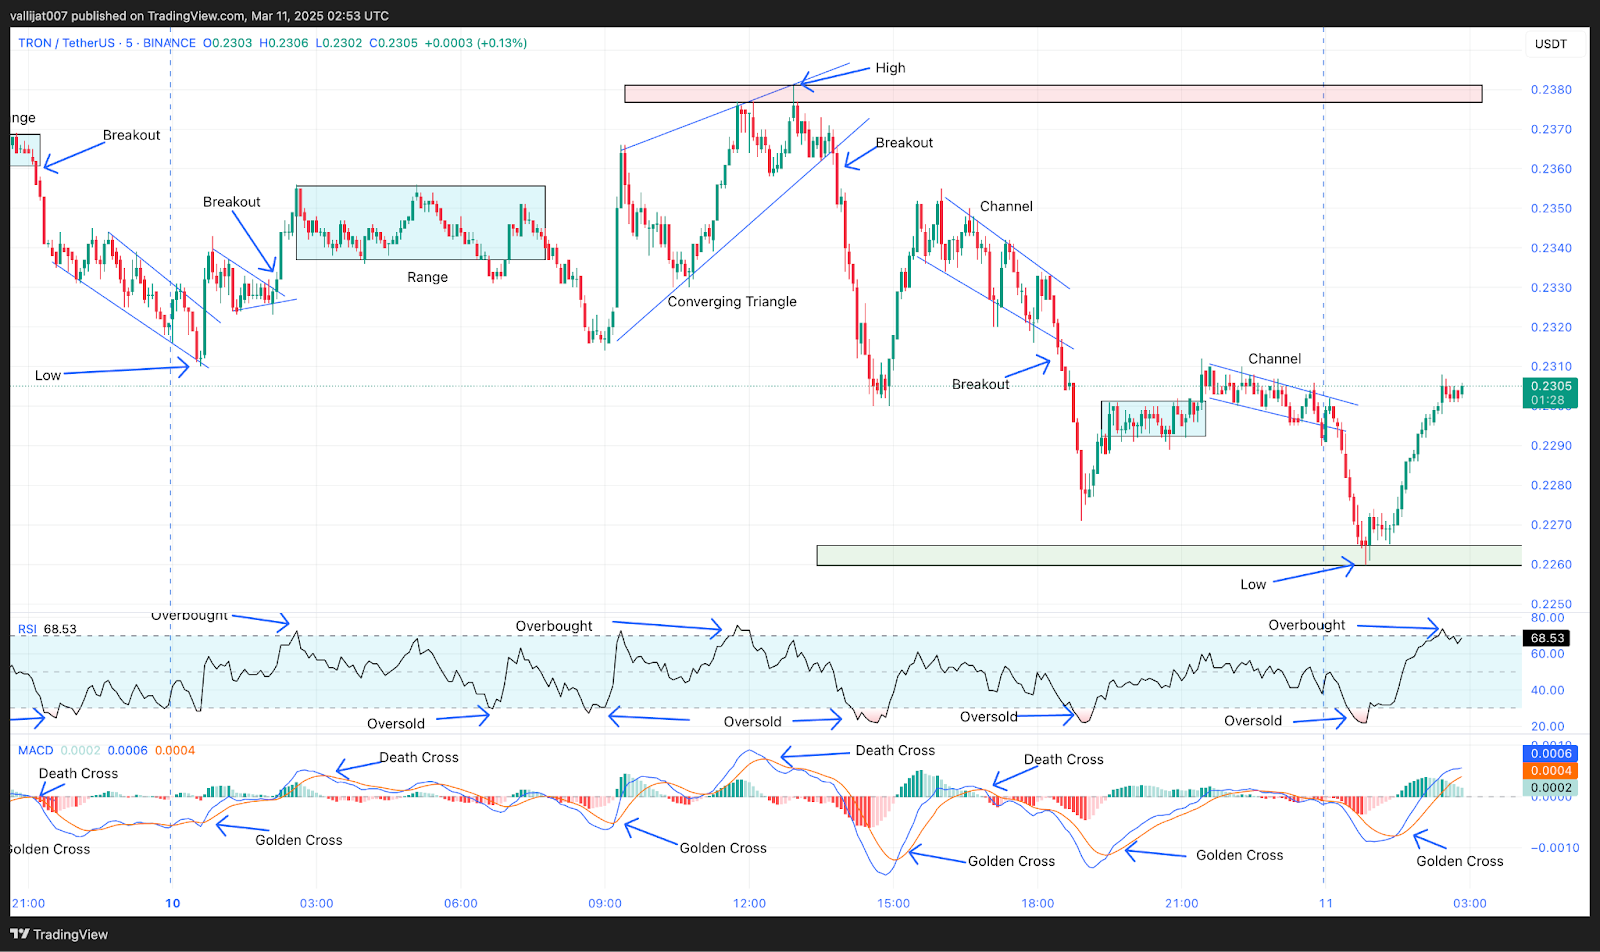
Chart 1: Analysed by vallijat007, published on TradingView, March 11, 2025
Based on Tron price analysis, at 08:05 UTC, the range broke out to the downside, corroborated by a golden cross in MACD, but failed to form a channel, giving birth to a converging triangle pattern to the upside. The converging triangle pattern marked the high of the day at $0.2380 and broke out to the downside at 13:50 UTC, corroborated by a death cross in MACD.
TRON Finds Support at $0.2260 but Faces Resistance at $0.2380
At 14:20 UTC, RSI dropped below the level of 30, indicating an oversold market condition, further supported by a golden cross at 15:00 UTC. The price spiked to the upside, forming a spike and a downward-moving channel. The channel broke out to the downside at 18:25 UTC, showing the conviction of the sellers.
At 19:30 UTC, a golden cross appeared in MACD, helping in the formation of a minor range. The minor range broke out to the upside, forming a minor channel. The minor channel again broke out to the downside, marking the low of the day at $0.2260. This area also created a support zone for the TRON price, as TRON recovered from this area rapidly.
The price level of $0.2380 is the recent resistance level for TRON. If this spike from the low is maintained, then TRON may gain some momentum. But if this level breaks, more downside trends could be seen.
TRON Shows Bearish Sentiment Amid High Selling Pressure in the Crypto Market
The TRON price shows a bearish sentiment as expected because Bitcoin and Ethereum are also facing high selling pressure. In the higher timeframe, TRON is in a trading range, and the next support level could be tested by TRON in the coming trading sessions. Traders and investors are encouraged to analyze the price chart by themselves, as the crypto market is subject to potential risk. Risk management and position sizing are two key elements that every trader and investor should keep in mind.

Coinfomania News Room
Editor
Related Posts

XRP Approaches Multi-Month Highs With ProShares ETF Approval, Is the Uptrend Toward $3 Imminent?
Emmmaculate Araka
Editor

Solana Price Climbs Above $150 on April 28 – Can SOL Hit $170 Next?
Buvaneswari
Editor

Virtune Launches Stellar ETP on Nasdaq Stockholm – A New Era for Crypto Investors
Khushi Thakur
Editor
Loading more news...