TRON Drops from $0.2490 to $0.2170: Does the Downtrend Reach its Bottom?
Traders are closely monitoring TRON price movements to identify potential breakouts in the cryptocurrency market, which is still highly volatile. Last week, we saw a major shift in the price of TRON. First, it crashes, and then the upside breakout causes the price to surge rapidly
Author by
Coinfomania News Room

Traders are closely monitoring TRON price movements to identify potential breakouts in the cryptocurrency market, which is still highly volatile. Last week, we saw a major shift in the price of TRON. First, it crashes, and then the upside breakout causes the price to surge rapidly. Can we expect the recent breakout to continue upwards, or will selling pressure cause prices to fall? In this article, we examine the recent price action, critical levels, and possible future movements. The TRON network’s development and increasing usage may also have an effect on market attitudes.
TRON Price Analysis for the Week
At 22:30 UTC on 24th February, the price broke out from an expanding triangle and formed a spike. The overbought condition at 07:00 UTC on Sunday, 23rd February, already indicated the overstressed market. The price at 02:00 UTC on 25th February showed that the overall market condition, indicated by RSI, suggested a reversal of the breakout or at least a pullback. At 03:30 UTC on 25th February, the price retested the breakout of the expanding triangle and formed a spike. The spike ended at 09:30 UTC on 25th February, and from there, it formed a channel.
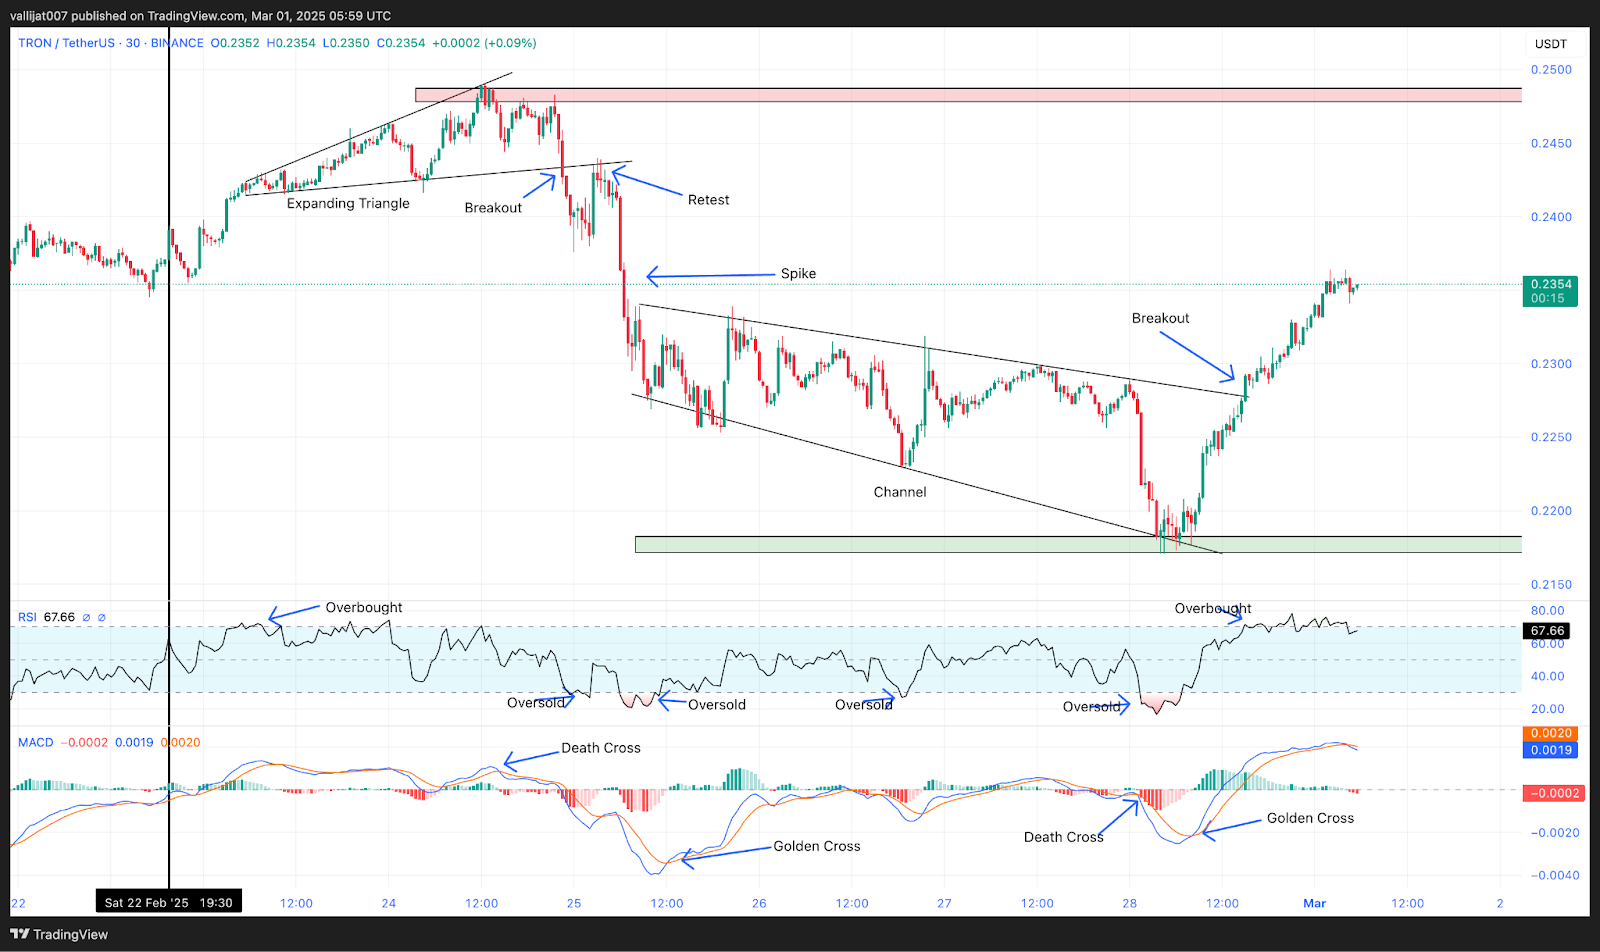
The channel marked its low of $0.2170 at 04:30 UTC on 28th February. At 12:00 UTC on 25th February, the golden crossover of MACD pushed the price up, which helped in the formation of the channel after the spike phase. On 28th February at 01:30 UTC, RSI showed the oversold market condition, while at the same time, MACD showed a death cross, both of which contradicted each other. On 28th February at 09:00 UTC, a golden crossover appeared in MACD, and the oversold condition of RSI collaborated and supported the price to move in an upward direction.
The price broke out of the channel it had created at 15:00 UTC on 28th February. The price is currently travelling in a spike, which may form a channel, or it may reverse. If the channel is formed and the breakout is successful, the first target should be $0.2490. If it fails, then the first target should be the low, which is $0.2170. Traders and investors should keep in mind that with every price drop, someone is waiting to buy, and with every price increase, someone is ready to sell, so take a position wisely.
Concluding Words
The last week was good for the momentum traders; contrarian traders might be back and the market may be once again trading in the range if that’s the case, then remember the critical support and resistance level. The upcoming trading sessions are crucial for determining the future trend of TRON. If the price continues to rise, a channel could be seen. Nevertheless, failure to maintain the breakout could lead to a return to the recent low and a continuation of the downtrend. Investors should be cautious and keep an eye on market sentiment before making any trading decisions, given the ongoing changes in the TRON network. The monitoring of TRX adoption and ecosystem growth could provide additional information on broader market trends.

Coinfomania News Room
Editor
Related Posts

XRP’s Growing Popularity Sparks Increased Interest in Cloud Mining Platforms
Coinfomania News Room
Editor

Solana Pushes for Sensible Crypto Regulations: A Game-Changer for the Future of American Blockchain

SUI Price Drops 5.4% on April 29 Despite Strong Weekly Gain
Buvaneswari
Editor

Virtuals Protocol (VIRTUAL) Gains 400% in April, Yet On-Chain Metrics Signal Weak Growth
Khushi Thakur
Editor
Loading more news...