


The previous week started with the global cryptocurrency market cap at $1.12 trillion. Two weeks ago, the market experienced a gradual drop in value that saw it dip below $1.1T but end close above.
The previous intraweek session was a continuation of the sector’s inability to register gains and hold on to them. To this effect, it peaked at $1.15 trillion but retraced to a low of $1.10T and closed at almost its opening price. A look at the chart showed price trends were filled with highs and lows.
Altcoins were the top gainers at this time. One such was RNDR. The asset surged by more than 40% over the last seven days. One of the key levels it flipped during this surge was $2.5 resistance. We noticed a lot of attempts at the mark during the period under consideration before it gave way on Sunday.
PEPE was one of the top losers over the last seven days. Although it losses were not huge, it lost more than 4%. As a result, it slipped down the global cryptocurrency market cap and is at 68.
Market fundamentals were almost non-existent as they failed to have any impact on prices.
With the week in it second day, the situation is the same. Nonetheless, the charts provide an insight into how price may perform.
Top Three Cryptocurrencies to Watch
BTC/USD
During the previous week, Bitcoin prices was mostly stagnant. It traded within a channel it failed to break out. As a result, it closed with no significant changes in value. We noticed a doji on the weekly chart which suggests the asset peaked and retraced to a low.

One of the main highlights took place on Tuesday when it opened at $26,933 and peaked at $27,666. Although the top asset closed the intraday session with no notable increase in price, this led many to anticipate more increases in price as Monday was also a green.
This never happened as BTC saw its biggest loss Thursday. It kicked off trading at $27,413 and dropped to a low of $26,374. It recovered but closed with losses of almost 3%. Nonetheless, the top coin registered its low of the week.
Over the next three days, the coin had very little change in price. However, many may look at the minute greens on the chart as a sign of an impending price improvement. A look at the indicators also points to this fact.
Although the metrics do show any large movement, they gradually edged to flipping bullish. For example, MACD is showing that BTC is in the process of a bullish convergence. The Relative Strength Index also steadied around 40.
With a focus on the current intraweek session, indicators are pointing to better price performance. For example, the Moving Average Convergence Divergence is displaying an interception of both the 12-day EMA and 26-day EMA. With an impending bullish divergence, prices may react positively.
One of the key levels to watch over the next five days is the $28k resistance. The apex coin edged closer to the mark but failed to retest it. As a result of the latest prospects, it may attempt the said level
KAVA/USD
Like most assets, the previous week was not favorable for the altcoin under consideration. It attempted the $1.1 on Saturday but failed to flip it. This happened as it gradually lost momentum and retraced to a low of $0.94 but recovered and closed at $1.04 which signified a more than 3% increase in value.

KAVA also saw a spillover of the bearish sentiment on Sunday. It dropped to $1 after peaking at $1.07. Aside from the weekend events, the altcoin had its biggest decrease in value on Tuesday. It kicked off trading at $1 and retraced to retest the $0.90 support but halted at $0.92.
With regard to indicators, they were fairly silent. Following key events a few weeks back, the Moving Average Convergence Divergence is still on the uptrend. However, the Relative Strength Index showed a lot of fluctuations during the previous intraweek session. Nonetheless, it remained above 50.
This week, the asset under consideration is seeing a lot of activity. It started the previous intraday session at $1 and briefly flipped the $1.1 resistance. The period ended with the altcoin gaining more than 5%.
Trading conditions at the time of writing are some of the most bullish. It started the day at $1.07. KAVA surged in one of the most unprecedented fashions. In a few hours, it gained more than 50% of its value. However, it faced rejection after it broke the $1.70 resistance. As a result, it is exchanging at $1.30 at the time of writing.
The altcoin is at a crossroads as the massive increase it experienced during the current intraday session is spreading fear across the market. It may see more increases or decreases. Nonetheless, based on previous price movements, KAVA may see massive retracements.
SNX/USD
The previous was one of the most anticipated, as many expected, massive price movements. Their speculations became reality as Synthetix gained more than 12%. Let’s go over some of the highlights.
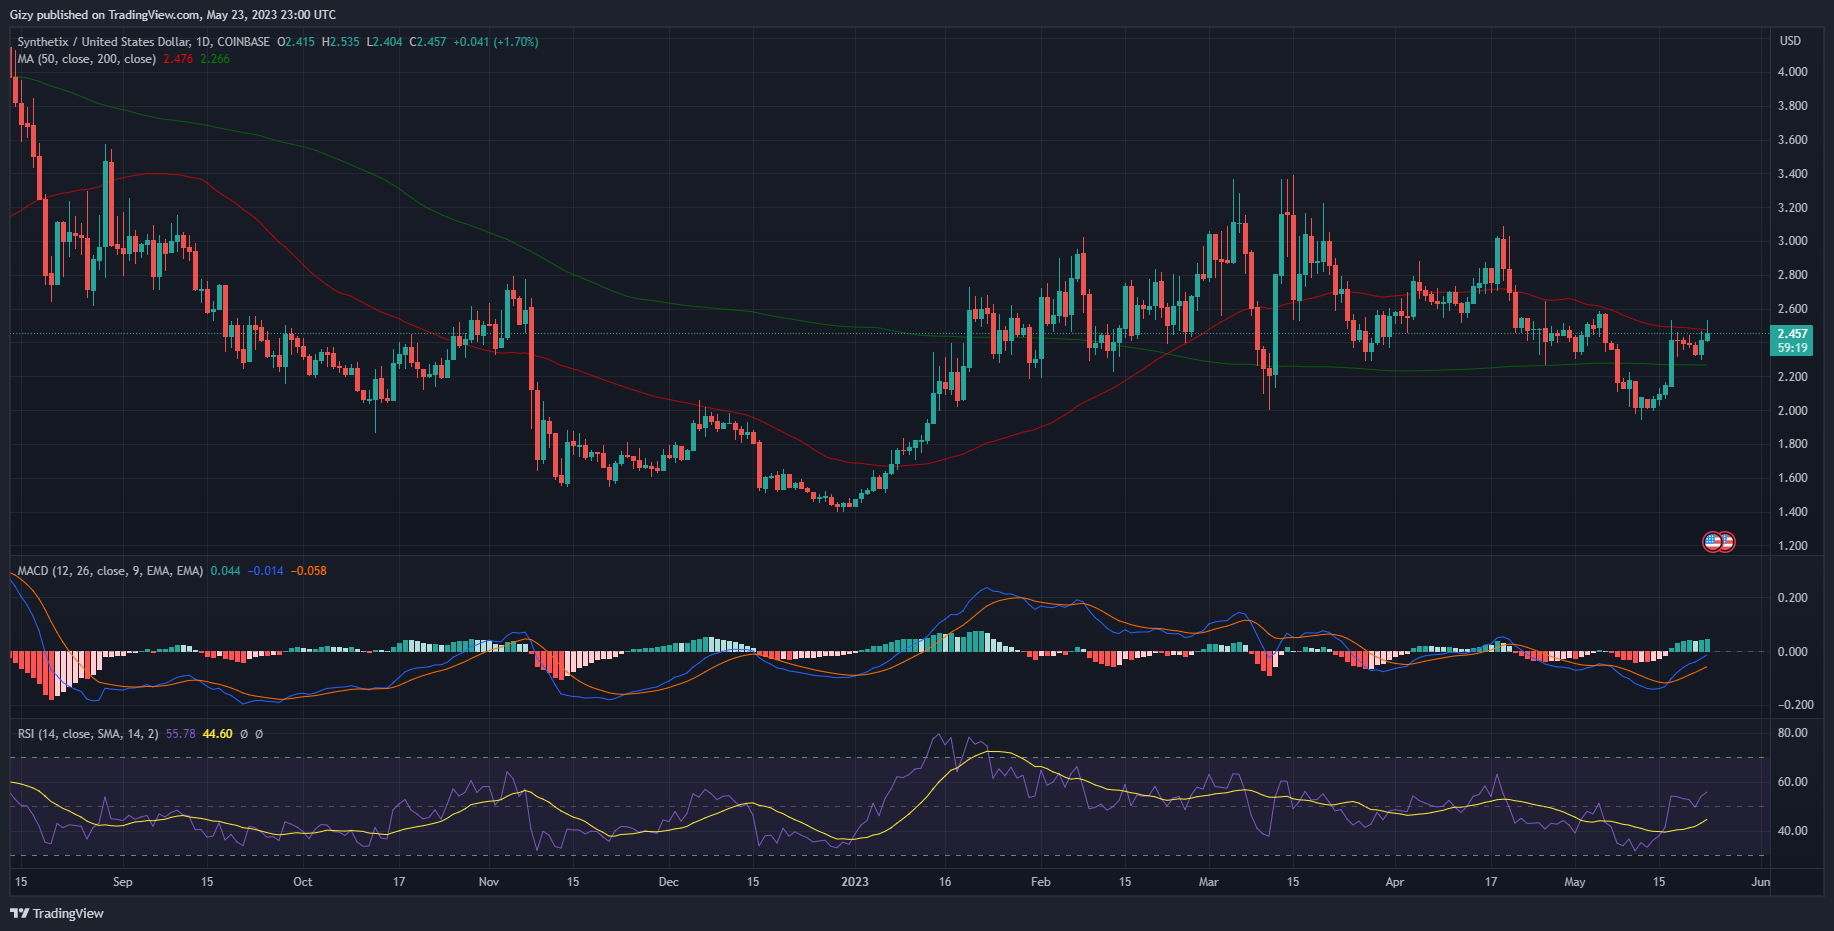
The altcoin had its biggest surge on Wednesday as it opened trading at $2.18 and retested the $2.5 resistance. It broke the level and peaked at $2.51. However, it retraced to and closed at $2.43. Nonetheless, it closed gains of more than 12%.
With focus on the new week, SNX may see more price increases. During the previous intraday session, the asset under consideration gained more than 5%. It made another attempt at the $2.5 mark but failed as it peaked $2.45.
The altcoin may test the highlighted mark and gain stability over it if trading condition remain positive.