


Gala and most crypto assets lost a huge fraction of their value during the previous seven-day period. It ended the week as the top loser and is showing no huge signs of recovery. Nonetheless, this decline had little to no effect on the global cryptocurrency market cap.
The crypto market started trading at $1.04 trillion. As the session progressed, it experienced small bullish moments that guaranteed it peaked at $1.06 trillion. However, it retraced back to its opening price and closed a little below it. This is an indication that the market failed to register any significant change in value during this period.
A look at the top gainers from the previous week says that most altcoins struggled. The second largest gainer is up by less than 5% and the third; less than 3%. This comes as no surprise as most assets in the top 10 are down by less than 2%; depicting how low volatility was “the order of the day.”
At the time of writing, trading actions are still the same. However, most assets gradually lose small fractions of their values. Nonetheless, the chart hints at a change in the current market trajectory. Let’s see how it will affect some assets.
Top Three Cryptocurrencies to Watch
BTC/USD
Over the last four weeks, Bitcoin performance is what many will refer to as unfruitful for more reasons than one. The most glaring is the fact that all four intraday sessions ended with the asset closing at its opening price; forming a doji.

The previous seven-day session is no different as the apex coin also closed at its opening price. It kicked off trading at $25,972 and retraced further after a brief hike above $26k. Nonetheless, the downtrend continued as it dropped to its lowest on Wednesday. It opened trading at $25,779 and had a significant correction after it touched the critical resistance. As a result, it dropped to a low of $25,386.
However, it had some of its biggest moves over the next two days. On Thursday, trading started at $25,750. As the day progressed, BTC experienced small increases that shot prices to peak at $26,417. Afterward, it dropped to a close at $$26,245, a little close to a 2% increase. However, it lost all of these gains during the next intraday session.
Following these notable moves, the asset returned to its previous trend of little to no volatility.
This week, bitcoin is showing huge potential with regard to volatility. It kicked off trading at $25,895 but is currently seeing a significant increase in selling pressure. Due to this, the apex coin is down by more than 2%. \
After flipping the $25k support, the asset is struggling. As a result of the most recent drop in value, the Moving Average Convergence Divergence is hinting at more downtrends. This comes after the 12-day EMA made contact with the 26-day EMA,
ETH/USD
Ethereum price at the time of writing is bearish. Nonetheless, this is an improvement in volatility as the coin closed the previous week with no significant change in value. Like the previous cryptocurrency, trading actions during this period were represented by a doji.

It kicked off the session at $1,635 and traded around the $1,600 support for the most part of the week. On very rare occasions did it dropped below this critical level. This was on Sunday when it dropped to a low of $1,596. A look at the chart suggests that nothing interesting took place over the last seven days.
However, the market is heating up at the time of writing. ETH kicked off the current intraday session at $1,616 and was considerably stable during the early hours. The crypto market started experiencing a shift in dominance. As a result, the largest altcoin is seeing a huge change in value.
It edged close to testing the $1,500 support but failed as it rebounded at $1,531. Currently exchanging at $1,544, it is down by more than 4%. Due to this, most indicators are bearish. One such is MACD as the 12-day EMA intercepted the 26-day EMA in one is referred to as a bearish divergence.
In addition to the Moving Average Convergence Divergence, the Relative Strength Index is also responding to the latest downtrend. The metric dropped below 30 which suggests that ether is oversold.
With huge signs of a significant drop in value, one of the key levels to watch is the $1,500 support. Although the most recent attempt failed, ETH is bound to see more within the next five days.
GALA/USD
Since the last week of July, GALA did not close any seven-day period with any significant increase. A closer look at the weekly chart depicts a downslide as the asset continued to lose support after support.
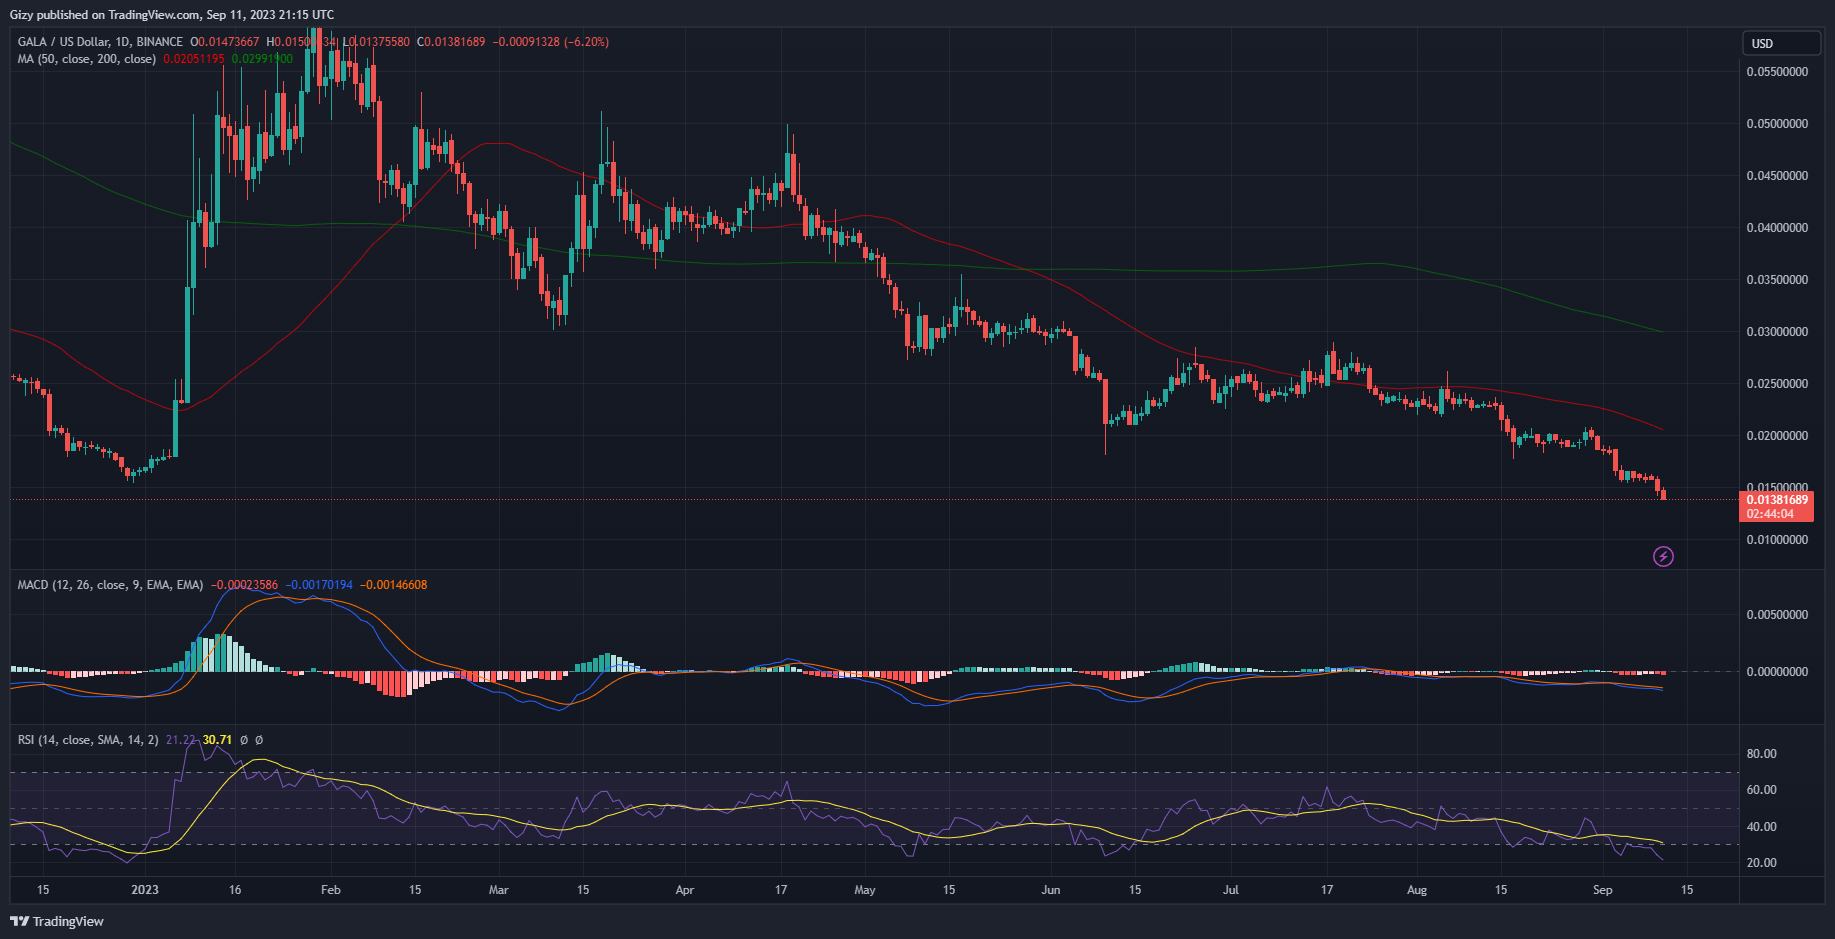
The previous intraweek session was no different as the asset failed to register any notable change in value. During that time, it lost more than 11% as it opened trading at $0.016 and retested the $0.014 barrier with small success. However, it reclaimed the level and closed above it.
The new week is no different as the altcoin is testing $0.014 again. Currently down by more than 4%, indicators like MACD and RSI are hinting at a possible retest of the $0.012 barrier.