


Last week was filled with a lot of trading activities for most cryptocurrencies as the entire crypto market experienced considerable hikes. The sector closed at $2.1 trillion after opening the session above $1.8T.
Many assets no doubt contributed to that increase as Zilliqa gained more than 100% over the last seven days. We expect more movement over the next six days as most cryptos are showing signs of further price increases. Supporting this claim, the image below shows that most projects are up by a few percent over the last 24 hours.
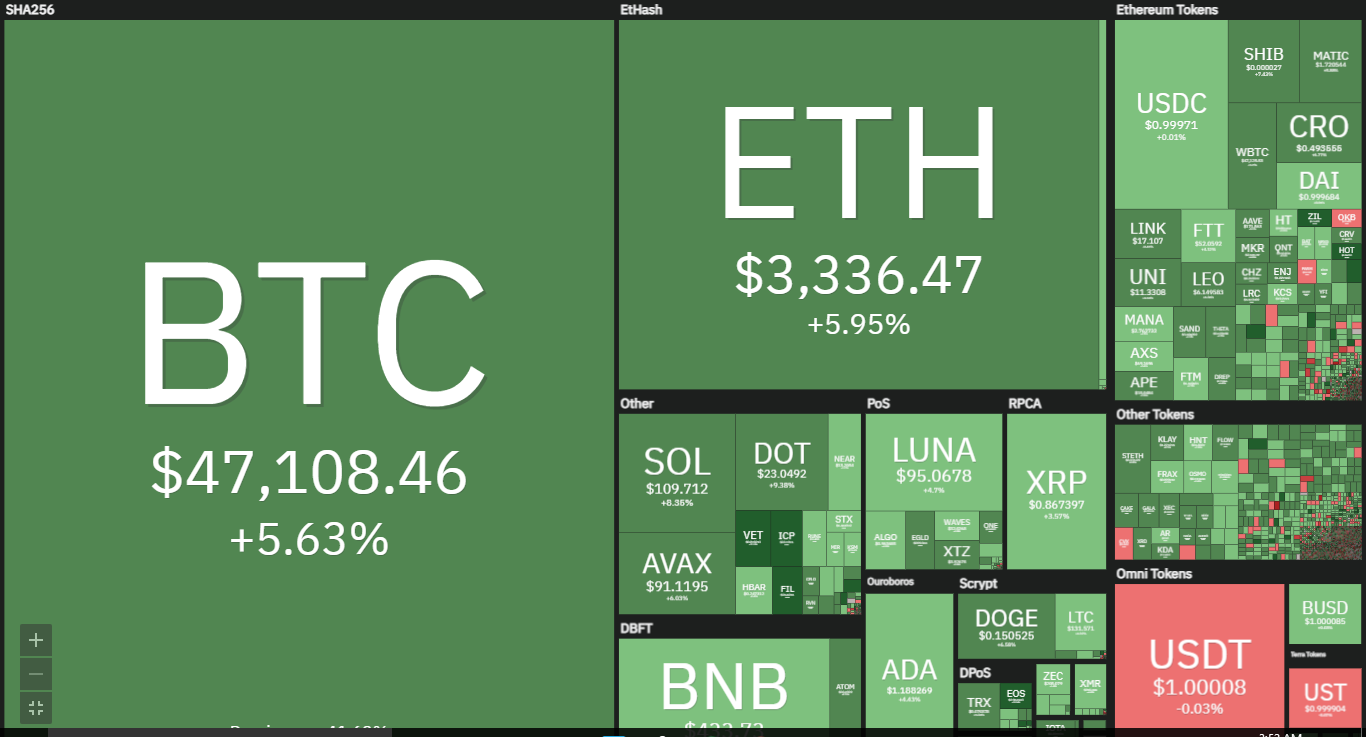
(Source: Coin360)
Here are the top four cryptocurrencies to watch this week
1. BTC/USD
The last seven days closed with the top coin gaining more than 10%. Several indicators flipped bullish during that time. Some of these metric include the Relative Strength Index (RSI), Moving Average Convergence Divergence (MACD) and Pivot Point Standard.
All these indicators are still bullish as of the time of writing. For example, MACD is on the rise and showing n signs of dipping – indicating that BTC will see more uptrends. A few hours to press time, the largest cryptocurrency made an attempt its first pivot resistance at $47,911 but failed as it edged closer to the mark.

It currently holds an intraday high of $47, 765. With the coin gaining stability above $47k, we may expect a retest of the resistance over the next six days. However, RSI may be a source of concern to the uptrend as its most recent reading placed it 69, hinting that top digital asset may be overbought if the uptrend continues.

On the other hand, the On-Balance Volume shows more money coming to the market with very little leaving. If this trend continues, bitcoin may flip its first pivot resistance this week. How high could the apex coin go?
As seen on the chart above, the $45,500 support is the closest to the current price. A bearish takeover could send BTC as low as testing the $45k support. However, this level may be a hard one to crack as it takes an increased amount of selling pressure to flip the mark, making it one of the toughest levels to watch this over the next six days.
Currently exchanging above $47k, the next price mark to test is the $48,500 resistance. Based on previous patterns, bitcoin may be unable to break above that level on the first trial as we observed that most attempts failed the apex coin was seen trading closer to the said mark.
While we may expect the largest cryptocurrency by market cap to flip the $48k resistance. It is important to note that the most recent candlestick is a shooting star – which may indicate a short pause to the uptrend.
2. ADA/USD
Last week, Cardano regained a key level that was lost more than 30 days ago. The coin closed that period with a more than 30% increase as it opened at $0.86 and closed at $1.18. The move was perceived as an indication of more hikes to come.
ADA flipped bullish on Thursday, a day after it broke the $1 resistance and was considered an asset with more price increase in view as per MACD. However, fear began to grow as the Relative Strength Index (RSI) suggested that the token was overbought.

Nonetheless, the asset under consideration closed the previous seven-day period above its pivot point. Current price actions suggest that the token has continued its uptrend into the new week.
Having flipped the 50-day MA during the previous intraweek session, the asset under consideration will look to sustain the previous momentum and edge closer to testing the 200-day MA.
MACD is still on the rise and is showing no signs of dipping. Based on this, we may conclude that ADA may continue to experience more price increases over the next six days. However, RSI may be printing an opposite reading as it suggests that the token is currently overbought.
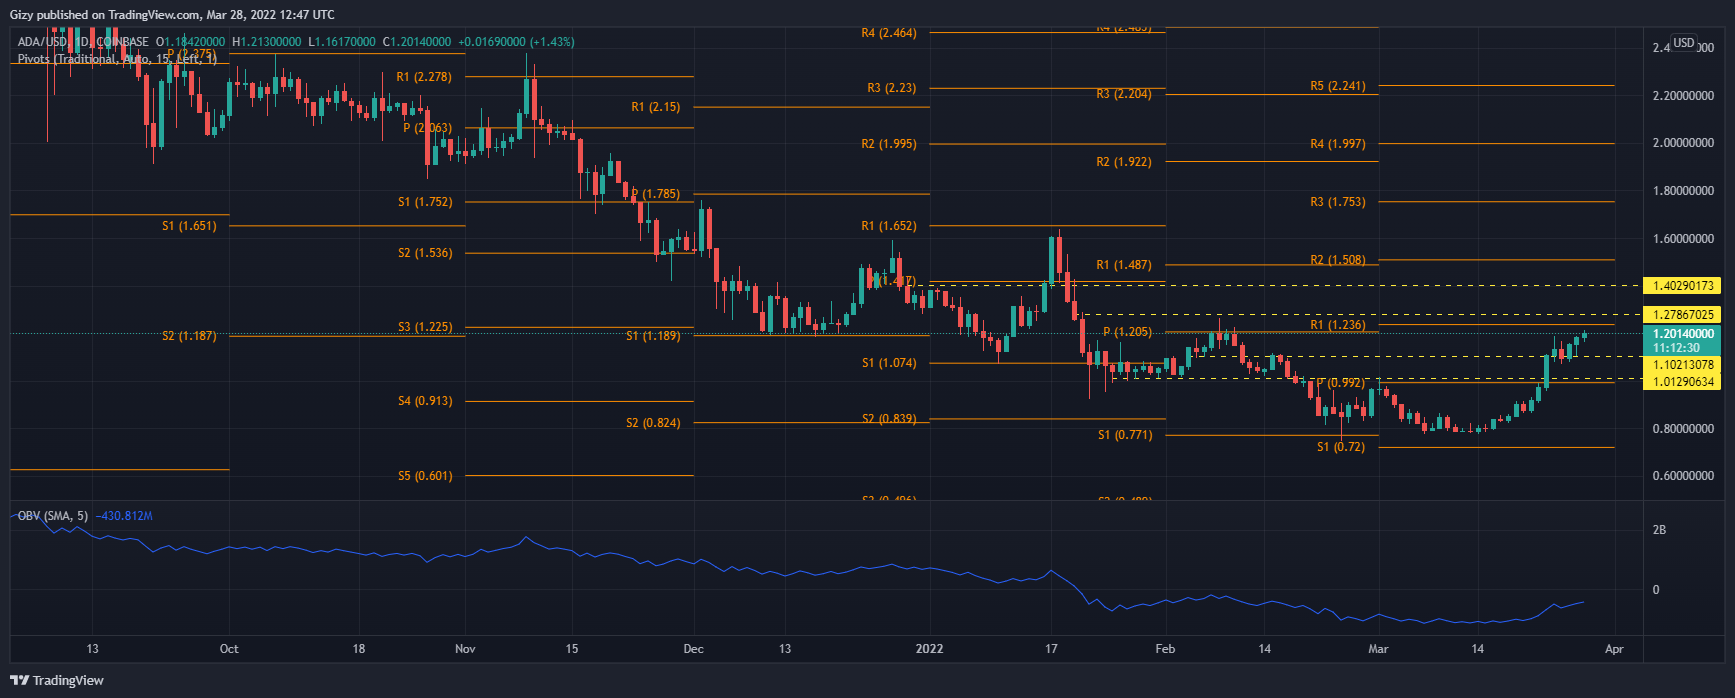
OBV shows that the coin is recovering from the low buying pressure it experienced some days back. The indicator shows no hint of slowing down, which is very promising for the cryptocurrency. How high will it go?
Having tested the first pivot resistance at $1.23, we may expect the ADA/USD pair to make an attempt at the $1.27 resistance. Although very unlikely, if cardano sees the same massive hike it saw last week, it may close the current intraweek session above $1.4 or closer to the mark. A bearish grip on the market may result in the coin seeking support at $1.1.
3. ETC/USD
The bulls showed their strength last week on Tuesday as Ethereum classic gained more than 30% in 24 hours. The first intraday session saw the coin fail to impress as it was represented by a doji.

With a more than 30% increase the next day, the buyer got confident. Unfortunately, ETC was hit by a massive price retracement that saw it dip by more than 12% on Wednesday. Additionally, the correction was in reaction to the surge during the previous intraday session that ended with the asset being overbought.
On Tuesday, the coin flipped the 200-day MA. However, it closed the week, gaining more than 25%. The Relative Strength Index is currently at 70, which means that any price increase could send it to the overbought region.
MACD may hold more warnings as the fast line is slightly arched and may descend to complete a bearish convergence. Trends over the last five days have resulted in ETC creating a new support. Nonetheless, another massive move could be on the horizon, following the most recent trading pattern.
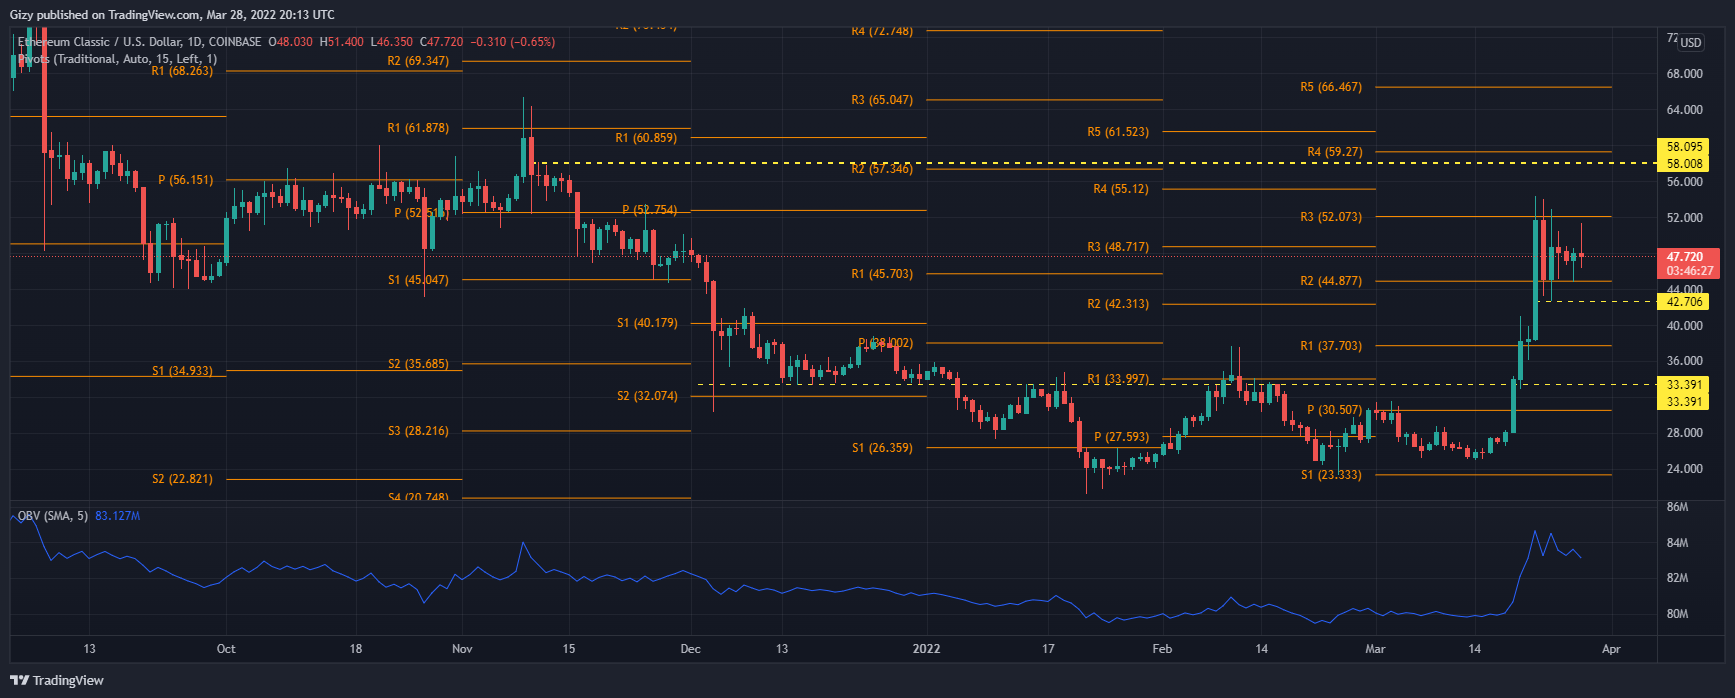
It remains to be seen how strong the support is as the $42 mark has been tested just once during this period. However, the bull must defend the level incase of bearish dominance as a flip may cause a freefall below $40.
Speaking of how high the asset could go this week, the third pivot resistance may be a critical level to watch as we may see further attempts at it. OBV currently shows that traders are taking profit as of this time.
4. VET/USD
A closer look at the chart, we noticed that Vechain has been on an uptrend for most of the previous week. Although it failed to impress on the first day but gradually picked up momentum as the days progressed.
VET saw the biggest surge over the weekend, as it gained 15% and 16% respectively. The coin closed the seven-day period with price changes worth more than 50%.

Nonetheless, the asset under consideration closed the previous seven-day period above its pivot point. Current price actions suggest that the token has continued its uptrend into the new week.
Having flipped the 50-day MA during the previous intraweek session, the asset under consideration will look to sustain the previous momentum and edge closer to testing the 200-day MA.
MACD is still on the rise and is showing no signs of dipping. Based on this, we may conclude that VET may continue to experience more price increases over the next six days. However, RSI may be printing an opposite reading as it suggests that the token is currently overbought.
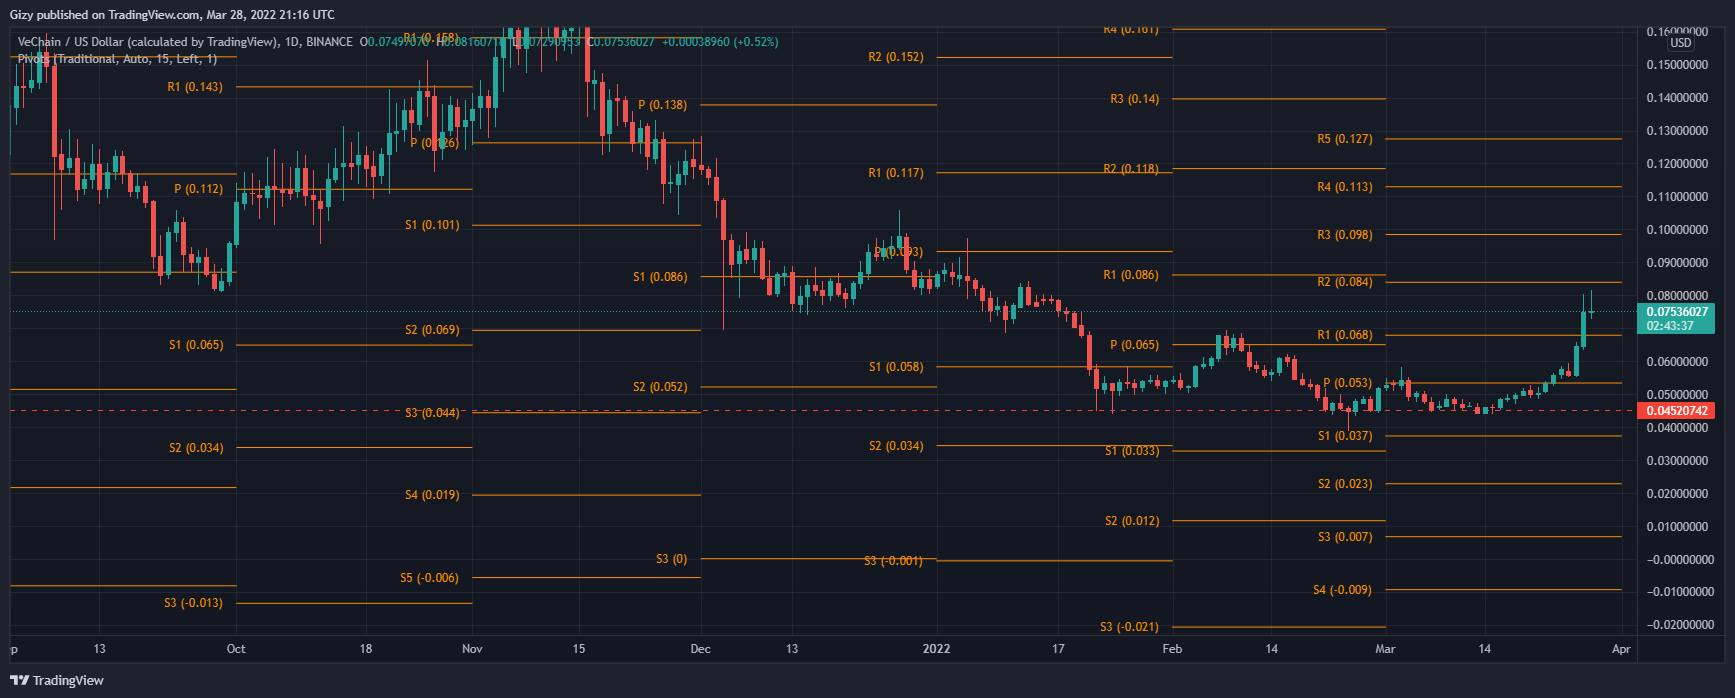
OBV shows that the coin is recovering from the low buying pressure it experienced some days back. The indicator shows no hint of slowing down, which is very promising for the cryptocurrency. How high will it go?
Having tested the first pivot resistance at $0.068, we may expect the VET/USD pair to make an attempt at the second resistance at $0.084. Although very unlikely, if VeChain sees the same massive hike it saw last week, it may close the current intraweek session above $0.09 or closer to the mark.
A bearish grip on the market may result in the coin seeking support at $0.053.