


Most major cryptocurrencies continued their ranging over the last seven days. The top gainer during this period of time is DOGE. However, it is up by less than 3% which is lower. It is safe to conclude that most assets had very little volatility.
This reflected in the global cryptocurrency market cap. It opened at $922 billion but dipped as low as $891B but recovered as the day continued. In the end, the sector under consideration close at $933 billion. Another week with no notable changes in valuation.
Aside from the low volatility, there was also very little to talk about with respect to fundamentals. There was no big positive story that could positively affect prices. Nonetheless, some news that made rounds over the last seven days includes Interpol opening an office in the metaverse to hunt Do Kwon.
Lamborghini showed its readiness for the metaverse with its recent exploration into NFTS. The crypto industry saw more participation from other fields during the previous week. Many are looking forward to more price movements over the next six days.
They are also looking forward to bigger fundamentals playing a massive role during the period under consideration. Will the bulls have their way?
Top Five Cryptocurrencies to Watch
BTC/USD
The previous week was the worst Bitcoin had since the present month started. A look at the weekly chart showed that it saw very little volatility over the last seven days. We observed an elevated low and lowered high during this period.

A breakdown of what happened showed that BTC recorded losses or gains of less than 2% (the lowest since it started trading sideways). Nonetheless, we may conclude that it was mostly bullish as more than four green candles are present on the daily chart.
The first was on Monday when the top coin made little progress and peaked at $19,600. As previously highlighted, it failed to record any notable gains or losses. It lost the little increases it had on Tuesday.
It saw its biggest push on Sunday as BTC returned to its previous high. As a result, it retested the 50-day Moving Average. Although it failed to flip it, the bulls may take this as a sign of an impending uptrend.
Another indicator to that furthered this claim is the Moving Average Convergence Divergence. The asset had a bullish divergence on Saturday. The increases on the last day of the week pushed the 12-day EMA up.
The Relative Strength Index indicated that BTC is seeing an increase in buying volume. It ended the week at 52. Prices are not acting as many would expect. RSI is currently at 48 as selling pressure mounts.
Previous weeks started with the apex coin seeing a notable increase on Monday, this current seven-day period seems different. Traders at this point worry if prices will play out differently this week.
The $20k resistance remains the biggest over the last fourteen days. Bitcoin may test and flip the highlighted mark. Nonetheless, based on previous price movements, the $19k may hold.
HT/USD
The past week was a continuation of the uptrend the exchange token started during the first week of October. Following a more than 63% leap two weeks ago, many expected the asset to lose momentum for more reasons than one.

One such reason for this conclusion is that it was overbought as per the Relative Strength Index. Huobi token defied all these predictions saw it saw another massive gain during the previous intraweek session.
Furthering this claim, HT’s first two days of the week were filled with consistent downtrends. Tuesday’s price decrease was the biggest as HT dipped to a low of $7.35. Nonetheless, it recovered and closed with losses of only 2%.
In response to this move, RSI gradually dipped to 70. Saturday was the main highlight of the week as the token gained more than 14%. This massive increase reflected on the weekly chart as it recorded a positive change of 28%.
HT was mostly overbought throughout the previous week and ended on the same note. The same phenomenon is playing at the time of writing. Nonetheless, the bears lurk. During the previous intraday session, it saw a low of $8.3 after starting at $8.77.
Nonetheless, we are seeing more bullish participation. As a result, it is up by more than 3%. Many wonders if the defiance will continue into this week. Its hard to say as the token is long overdue for corrections.
One of the key levels to watch over the next few days is the $10 resistance. Currently trading above $9, HT may retest the highlighted mark if the trajectory remains constant. However, a reversal of the current market trend may result in a dip as low as $7.30.
AAVE/USD
AAVE was one of the contenders for top gainer during the previous week. It had a good start to the session as we observed a more than 3% price change at the time. The increase continued with another 4% positive change on Tuesday.
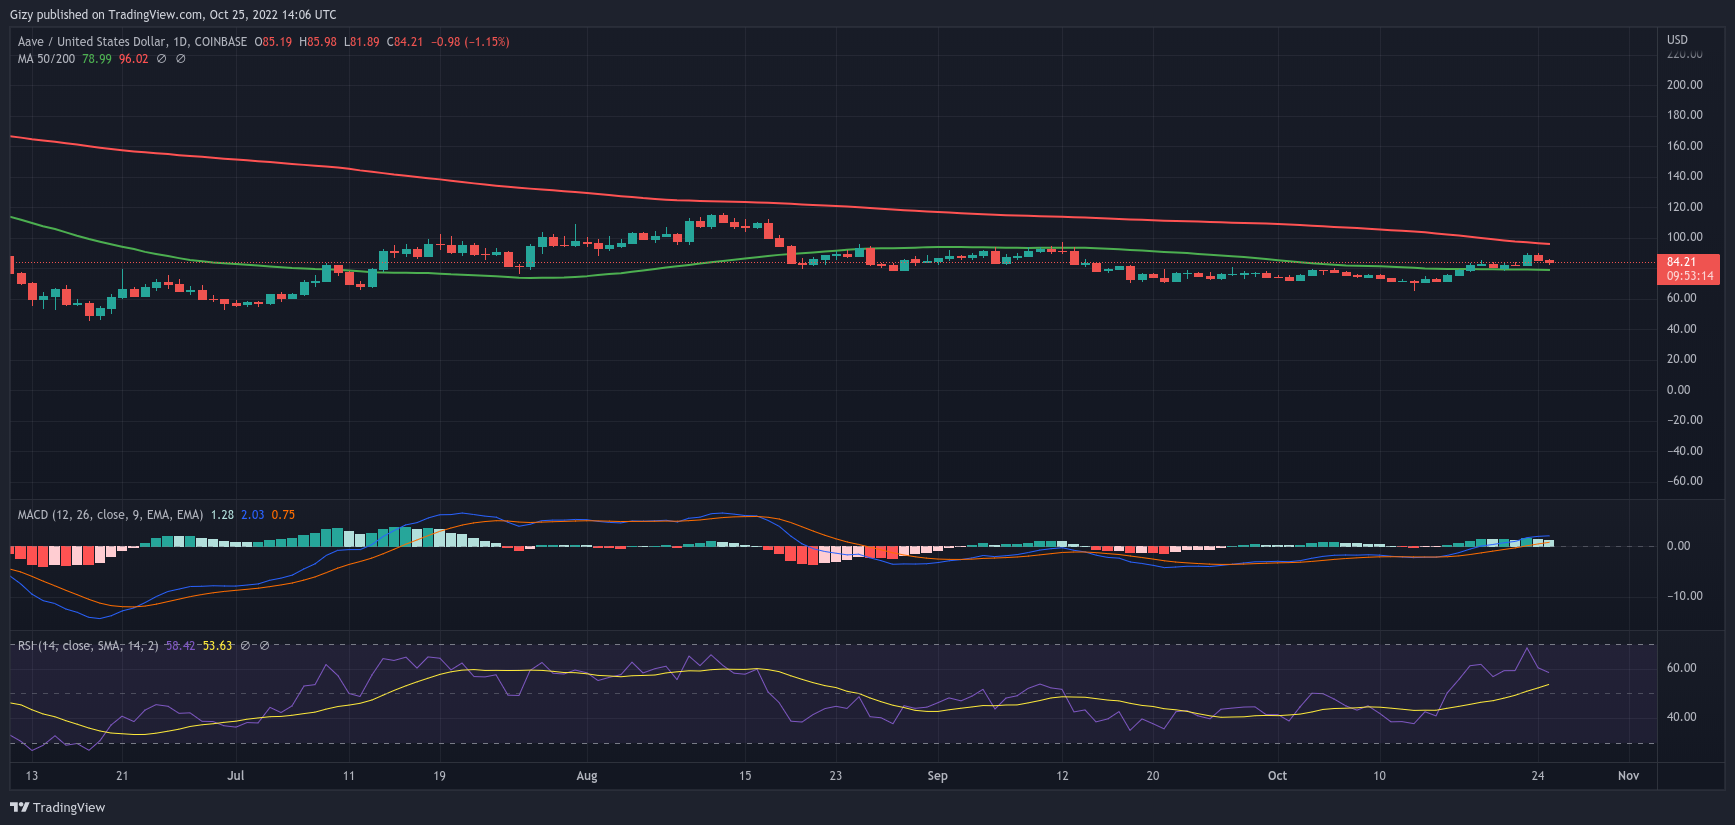
The biggest highlight for the previous seven-day period happened on Sunday when it surged by more than 8%. It ended the period under consideration with gains of more than 17%. The change in price also reflected on indicators.
Following the bullish divergence two weeks ago, the 12-day EMA has been on the uptrend. It maintained this form throughout the previous week. RSI also moved in response to the consistent increases the asset was seeing.
All these readings are normal with no clear indication of a trend reversal. However, price action over the last 39 hours hinted at more price decreases. It is currently down by more than 5%. Indicators are also taking a different turn.
The histogram associated with the Moving Average Convergence Divergence is gradually reducing in response to the decrease in buying pressure. RSI is also taking this queue as well. It ended the previous week at 68 (the highest in more than three months).
The 12-day EMA seems to have a brick wall at 2 as it is no longer surging. This could be an indication of more downtrends ahead. If the current retracement continues, we may the asset under consideration retest the $78 support.
Nonetheless, improvements in market conditions may send AAVE on a bullish spree. Currently trading above the 50-day MA, it may retest the 200-day at $96. However, before the retest, the cryptocurrency must gain stability above $90.
APT/USD
This is one of the newest cryptocurrencies in the crypto market. It was introduced to the market on Wednesday and garnered a lot of attention following its release. One of the highlights of the week was on Saturday when it had a more than 19% increase.
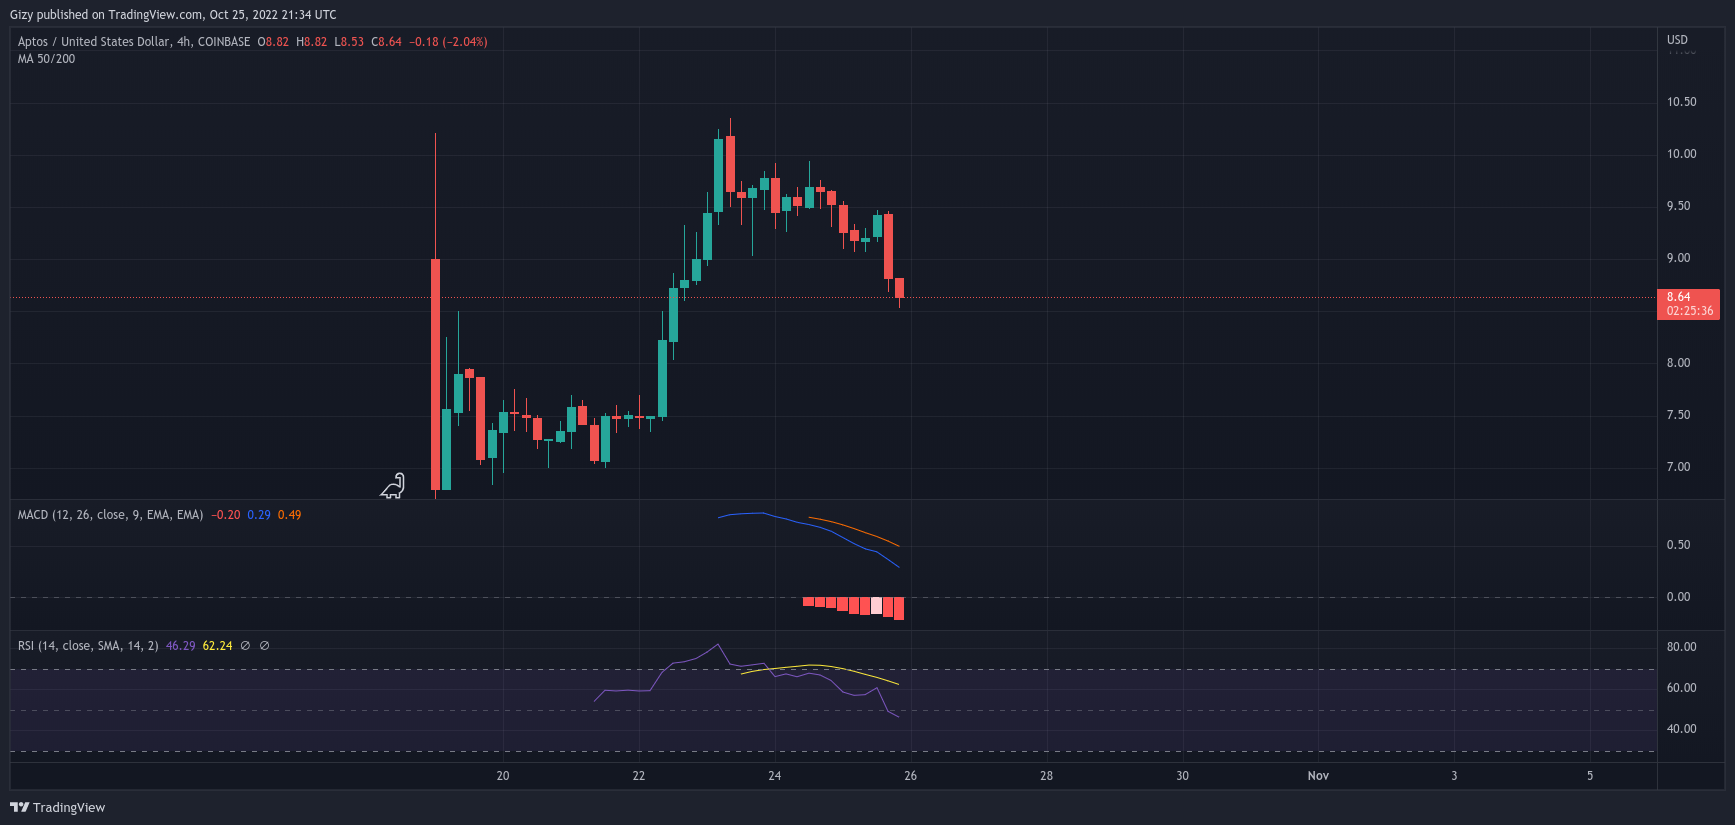
Sunday was another bullish period and the token enjoyed an 8% positive change. On the weekly, it gained almost 30% (excluding the initial drop in price). It is hard to predict what will happen with this asset over the next five days.
One reason for this conclusion is the fact that there are no indicators. Nonetheless, based on price movements we deduce the key levels to watch. On the 4-hour chart, we noticed a notable demand concentration at $7.30.
Currently down by more than 10% on the weekly, we expect the downtrends to halt at this support. If it fails, the $7 barrier is another key level to bank on. However, a change in trajectory would mean more price increases. We observe several rejections at $9.5. A flip of this mark would open up the $10 resistance.
KLAY/USD
Klay experienced massive bullish action during the previous week. For the first time in more than two months, the token tested and broke the $0.28 resistance. This happens on Sunday as the bulls rallied it.
 ns to
ns to
It met strong resistance after attaining the high and was sent down. Nonetheless, it closed higher than it opened trading and closed with gains of more than 31%. KLAY is no doubt one of the top gainers from the past week as it closed with gains of 28%.
In response to the sudden spike in price, the Relative Strength Index increased to as high as 68. Before this, the cryptocurrency under consideration was oversold. It also had a bullish divergence during this period.
There are no indication from these metric that KLAY would experience massive retracements. Nonetheless, based on price movement, we may conclude that such an increase with no gradual build-up may be short-term.
The bulls may struggle to hold the accumulated gains. It hit a low of $0.12 last week. That may be the toughest positive barrier to watch. Before that, we observed an increased demand concentration at $0.18 (another key support). A trend reversal may guarantee a retest of the $0.22 resistance.