


Last week, the cryptocurrency market opened at $1.72 trillion but retraced to $1.70 trillion as it failed to pick momentum. The sector peaked at $1.9 trillion as most assets hiked by a few percent. Unfortunately, the pump could not be sustained as the global cryptocurrency market cap dipped closed at $1.84 trillion.
The distance between the opening price and closing suggests that the industry has seen a more than 9% increase. The sector is off a two-week long trend that saw it open and close an intraweek session at the same valuation.
Bored Ape Yacht Club Launched ApeCoin a few days back and HSBC announcing a partnership with The Sandbox to engage with virtual communities in the metaverse were some of the stories that made waves last week.
Many were also thrilled when the United States Department of Justice (DOJ) announced that it has recovered and returned 12.164699 BTC, worth around $483,595 to an elderly man who resides in Asheville, North Carolina.
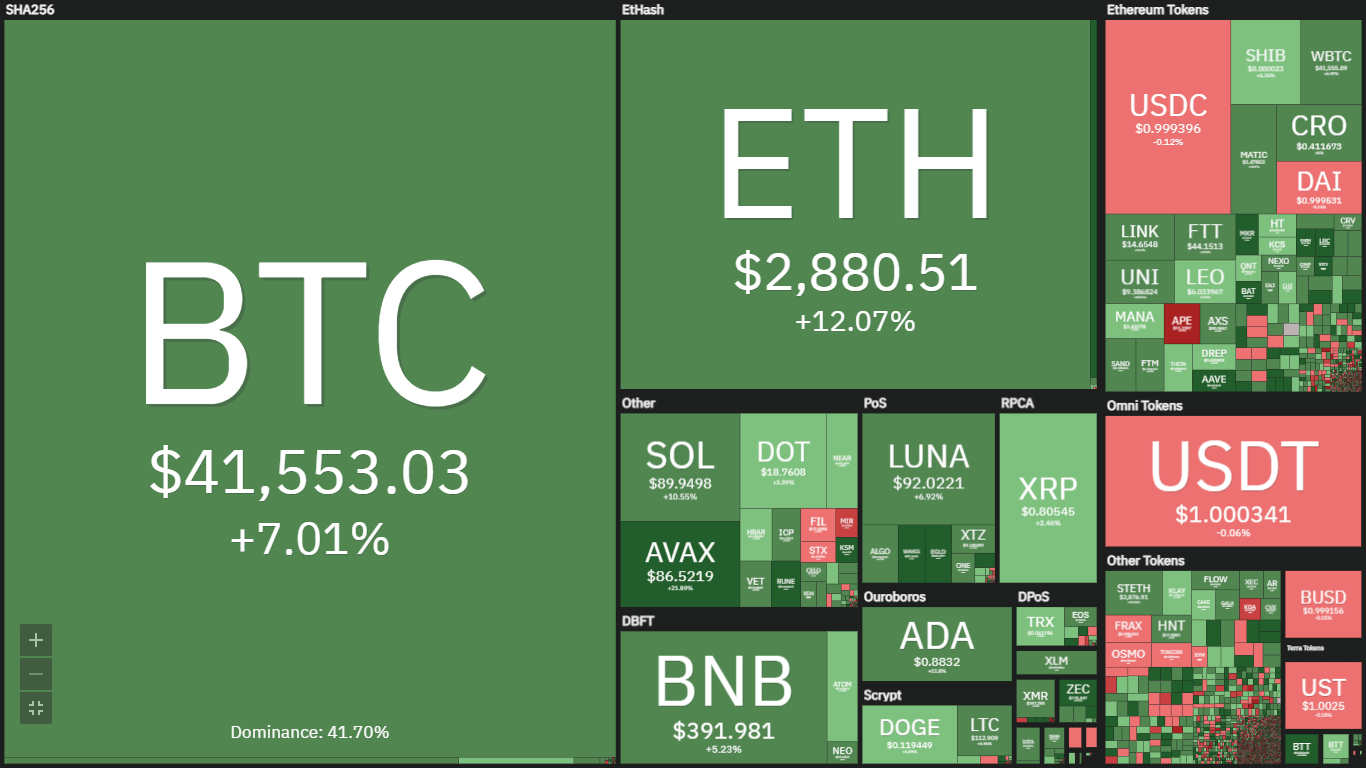
The image below further depicts what transpired in the market over the last seven day. Apecoin was the top gainer as it gained more than 1000%. Meanwhile, the top loser is Anchor Protocol, as it is down by 11%.
Many will expect a continuation of last week’s sentiment. Unfortunately, it is almost completely absent. However, there are several bullish news and a petition by the Malaysian Ministry of Communication and Multimedia deputy, Datuk Zahidi Zainul, for crypto assets such as bitcoin should be adopted as a legal tender in the country is one of these stories.
With a brief overview of the industry, let’s examine how some assets will perform over the next six days.
BTC/USD
Last week, Bitcoin opened trading at $37,763, and saw a lot of bullish actions on the first day of the week. Following an almost perfect start to the seven-day period, the rallies subsided on the second day.
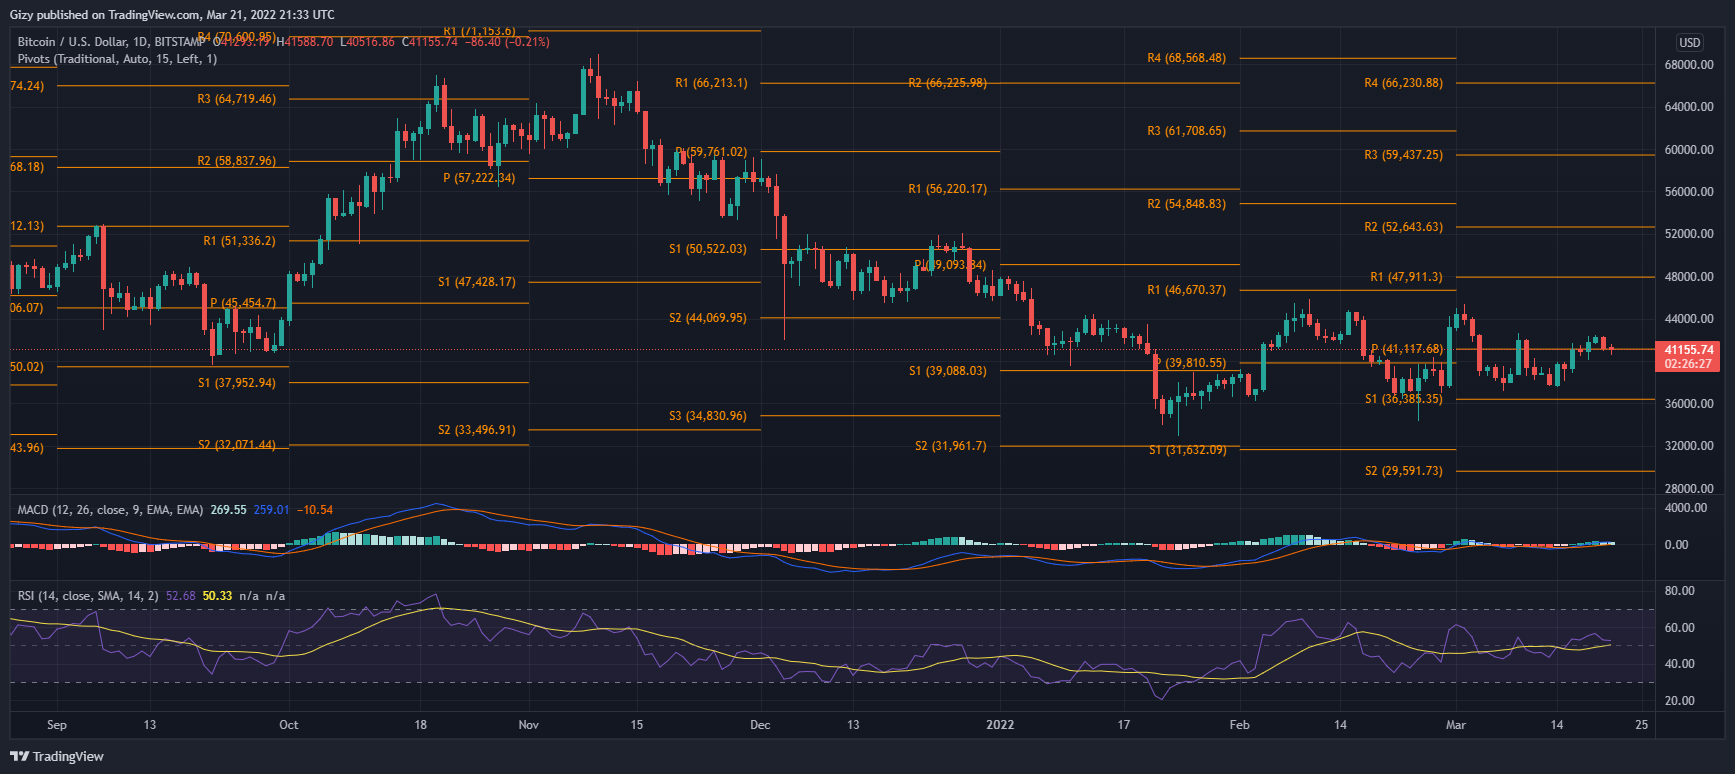
The apex coin failed to continue the uptrend as it retraced after an attempt at $40k that stopped at $38,896 on Tuesday. However, the asset rallied on Wednesday as it gained almost 5% and closed above $41k.
Many critical levels were gained during that time. One such is the $40,000 resistance that became support after a test on the third intraday session. The top coin hit a high of $42, 405 and the opening price served as the intraweek low.
We observed that the top coin had a bullish divergence on the Moving Average Convergence Divergence (MACD) five days ago which signaled the start of the uptrend. The asset went as above its Displaced Moving Average (DMA) is currently above it.
At the end, Bitcoin gained almost 10% over the last seven days. Amidst bullish readings from various indicators, the Relative Strength Index (RSI) is taking a dip after a more than four-day hike as a result of a decrease in demand concentration. Additionally, the top coin closed above its pivot point despite the drop on Sunday.
The candle representing the current session is a doji which indicates that BTC is seeing a lot of trading volume but is yet to record any significant gains or losses. There are threats of more downtrends as MACD is losing momentum and we may see a bearish convergence within the next six days.
ETH/USD
The previous seven-day period Ethereum opened trading at $2,516, and saw a lot of bullish actions on the first day of the week. Following an almost perfect start to the seven-day period, the second largest cryptocurrency was bullish all the way.

We observed that the top coin had a bullish divergence on the Moving Average Convergence Divergence (MACD) four days ago which signaled the start of the uptrend. The asset went as above its Displaced Moving Average (DMA) is currently above it.
Over the next three days, after the asset experienced the divergence, it gained approximately 3% everyday. During the hike, a lot of key levels were reclaimed. One such is the $2,900 resistance that became support after a test on Friday. The top coin hit a high of $2,988 and the opening price served as the intraweek low.
At the end, ETH gained almost 12% over the last seven days. Amidst bullish readings from various indicators, the Relative Strength Index (RSI) is taking a dip after a more than four-day hike as a result of a decrease in demand concentration. Additionally, ETH closed above its pivot point despite the drop on Sunday.
The largest alt is one of the many cryptocurrencies to watch this week as it seems to have continued the uptrend. Although not recording any significant increase, it is up by a few percent. MACD’s histogram is printing bullish signals as we observe an increase in buying pressure that may play a vital role over the next six days.
LUNA/USD
The coin experienced a bearish divergence at the start of the previous intraweek session owing to the gradual decrease in buying volume. Traditionally, this has been a signal for more downtrends. However, the bulls managed to keep the asset above its opening price.
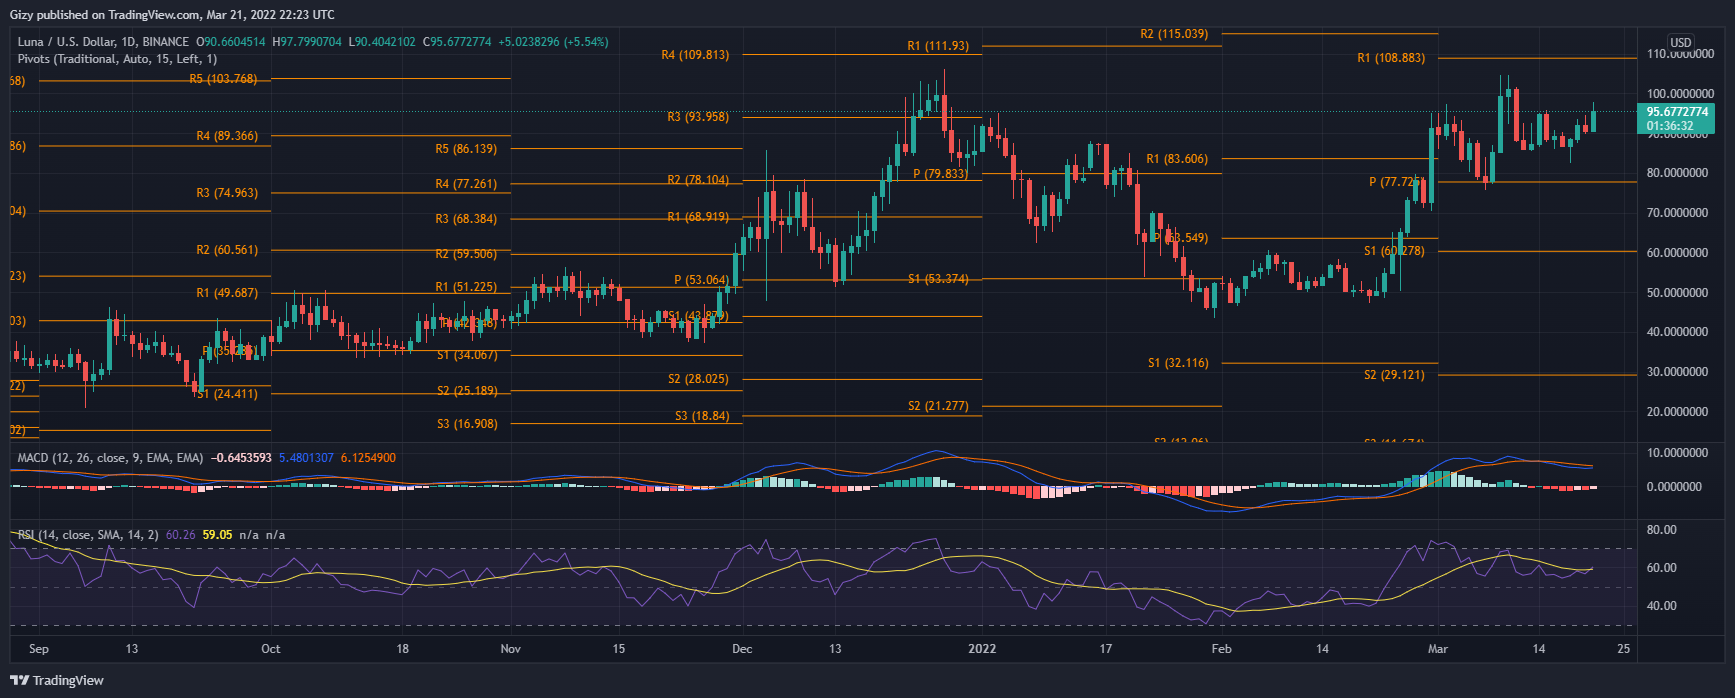
Terra was mostly bullish over the last six days, but recorded its biggest loss on Tuesday as it dipped by more than 6% – almost making the previous day’s gains void. The project hit a high of $95 and a low of $82.
During the hike, a lot of key levels were reclaimed. One such is the $90 resistance that became support after a test on the first day of the week. The cryptocurrency held on to the $85, support for most of the session.
The seventh largest coin coin is one of the many cryptocurrencies to watch this week as it seems to have continued the uptrend. Terra has regained momentum as it’s currently up by more than 5% over the last 22 hours.
MACD’s histogram is printing bullish signals as we observe an increase in buying pressure that may play a vital role over the next six days. An increase in demand concentration will result a in bullish convergence within the next six days.
ETC/USD
The previous seven-day period Ethereum classic opened trading at $25, and saw a lot of bullish actions on the first day of the week. Following an almost perfect start to the seven-day period, the second largest cryptocurrency was bullish all the way.

We observed that the top coin had a bullish divergence on the Moving Average Convergence Divergence (MACD) four days ago which signaled the start of the uptrend. The asset went as above its Displaced Moving Average (DMA) is currently above it.
However, the biggest gain happened on Saturday as the asset gained more than 20%. During the hike, a lot of key levels were reclaimed. One such is the $30 resistance that became support during the biggest surge. The top coin hit a high of $40.9 and the opening price served as the intraweek low.
At the end, ETC gained more than 50% over the last seven days. However, the token is overbought as at the time of writing as per the Relative Strength Index (RSI) that is above 70. we may expect the project to experience a little downtrend as a result of a decrease in demand concentration.
The 29th coin by market cap is one of the many cryptocurrencies to watch this week as it seems to have continued the uptrend. ethereum classic is up by a few percent as at this time which indicates that it is still bullish. If the bulls continue to sustain prices above the current mark, we may see an attempt at $45.
KSM/USD
Kumasa is one of the many projects previous week in gains. The coin no doubt saw a lot of volatility, like most digital assets, last week as it thrived closed with notable profits.
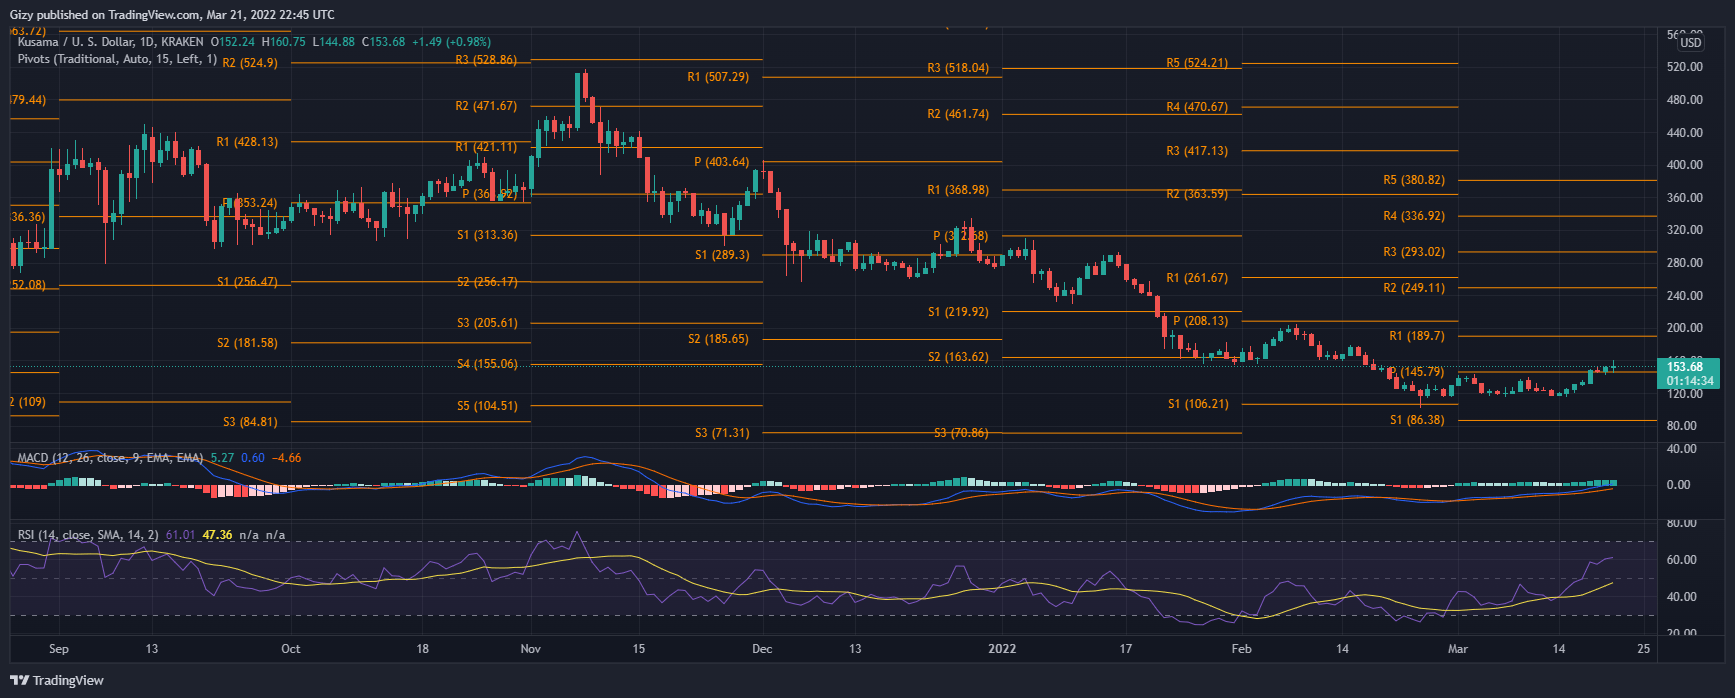
The token gain more than 29% during the previous intraweek session – creating new supports. Of all these levels, the $120 support appears to be the toughest as price dip was halted at that region.
KSM has continued the bullish trend as it is currently up by a few percent. The coin recent feat has made the pivot point a support. Additionally, MACD histograms are displaying a gradual increase in buying volume – a possible sign of the continuation of the bullish trend. Kumasa may test the $165 resistance if the current trajectory is maintained.