


Most cryptocurrencies performance during the previous intraweek session was one that many would stagnant. We also see this sentiment in the global cryptocurrency market cap. It started Monday at $926 billion.
The industry lost its valuation as the intraday session progressed due to a notable drop in the prices of some major assets. As a result, it dipped to a low of $729 billion but recovered to its recent value.
It peaked at $970 billion but gradually decreased in worth. The previous seven-day period ended with the sector under consideration at $941B. It is safe to conclude that there was little to no change in valuation.
Many would attribute this to the lack of positive fundamentals. They are partially correct as the only massive news that made rounds during the time under consideration is that Elon Musk showed renewed interest in purchasing Twitter.
The entire crypto market was shocked to learn that the blockchain they claimed was the most secure fell victim to a cyberattack. Binance Smart chain lost $570 million to these threat actors. Interestingly, no group came out to claim responsibility for the attack.
Following the low trading volume across the market last week, traders are looking forward to a more robust performance within the next six days. Let’s take a look at some cryptocurrencies.
Top Five Cryptocurrencies
BTC/USD
Bitcoin failed to perform as many anticipated during the previous intraweek session. It saw several days of low volatility and consistent price decreases. Nonetheless, it also recorded notable price increases.

For example, it ended Monday with gains of more than 3% after adding $600 to its worth. On Tuesday, it flipped the $20k resistance and closed with increases exceeding 3%. It is also important to note that this was the biggest positive change it had.
Following two days of notable increases, the coin met strong resistance to more uptrends. It was mostly bearish during the next three days with little or no volume on Sunday. In the end, the top coin ended the week with no significant losses or gains.
A closer look at the indicators may erase any hope of a surge. The Moving Average Convergence Divergence closed with both 12-day EMA and the 26-day reaching a block in their uptrend. RSI also closed below 50.
Yesterday, bitcoin failed to surge. We are also seeing the same during the current intraday session. MACD is hinting at a bearish convergence and after, a divergence. If this happens, there is no doubt that the apex coin will experience notable corrections. The $19k support is one that BTC held mostly for the past two weeks.
It will break as we observe mounting pressure on it. If it breaks, we may expect a retest of the $18k support. This is one of the toughest levels to watch over the next six days. A change in market conditions may mean more uptrends.
One key level the largest cryptocurrency will flip is $20k. Based on recent price movements, we also conclude that the top asset may range this week. We may see it linger between $19k and $18,400.
ETH/USD
Ethereum price performance during the previous intraweek session mimics that of BTC. It had a good start to the session as it surged from $1,277 to a close at $1,323. It ended Monday with gains exceeding 3%.

On Tuesday, the bullish sentiment continued. We noticed further attempts to the top as the altcoin peaked at $1,370. Nonetheless, it closed with a price change of almost 3%. This was the end of the bullish dominance.
During the next intraday session, it saw very little trading volume that resulted in the asset recording no significant losses or gains. The bulls tried to restart the uptrend on Thursday as the coin peaked at $1,383.
However, they failed as it faced strong rejection at its peak. Low volatility continued until the end of the week. On the weekly chart, ETH saw its first green after three consequent reds. It saw a positive change of 3.83%.
The indicators tell a different story from the happy ending. Similar to the previously highlighted cryptocurrency, the largest altcoin also saw a halt in MACD. Additionally, the Relative Strength Index dipped in response to the massive drop in buying volume.
The current week is looking grim as the ether failed to record any gains since it started. Yesterday, it almost lost 3% of its value per unit. During the present intraday session, there is no improvement. The price decrease persists.
A look at the indicators raises concerns about more downtrends. MACD is currently going through a bearish convergence. RSI just dipped below 40. ETH is exchanging below $1,300 as at the time of writing.
This means it is close to testing the $1,200 support. We observe there is massive demand concentration at this point, making it one of the key levels to watch. Nonetheless, if market conditions change, we may see the altcoin above $1,300 with eyes set on retesting $1,400.
XRP/USD
Ripple was the top gainer in the top 10s during the previous intraweek session. It recorded gains of more than 18% and also had a good start to the session. The asset was mostly bullish during this period.
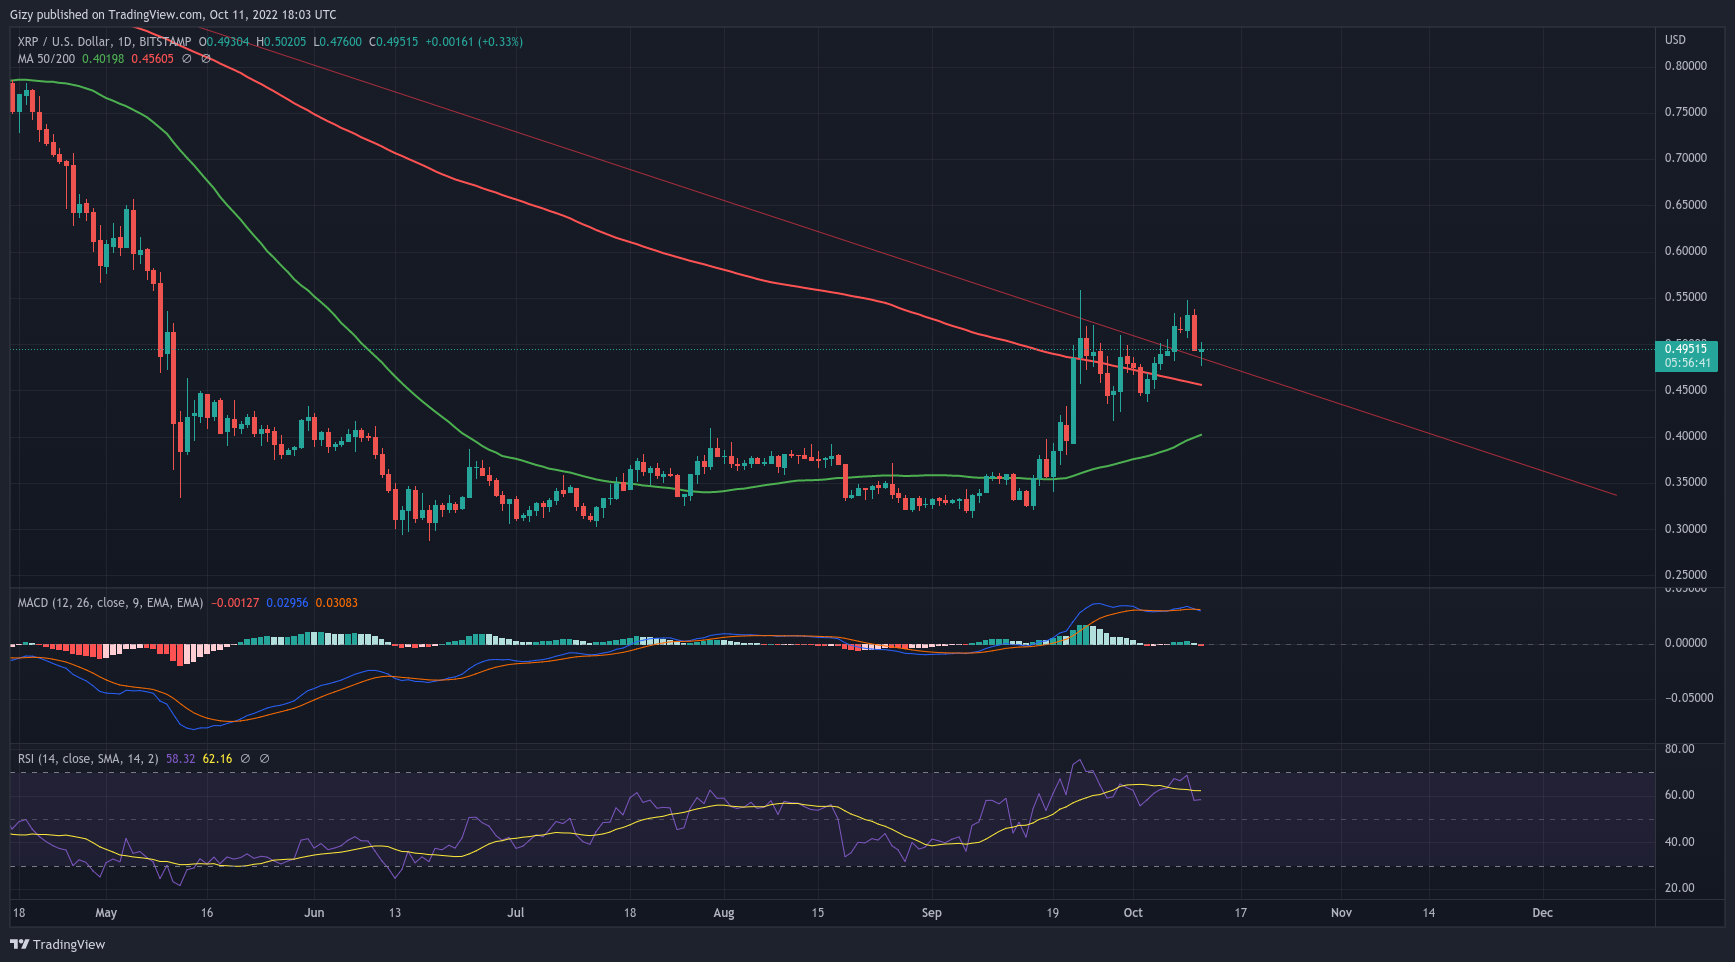
For example, it kicked off Monday by reclaiming levels it lost. It surged from a low of $0.43 to close at $0.46, earning it a 3% change. The uptrend continued into the next day as we observed another two-cent move.
It ended that intraday session with more percent change than the previous. It experienced high volatility on Wednesday as it peaked at $0.50 but met strong resistance at the mark. It ended at $0.49 and recorded gains of almost 3%.
Lower trading volume on Thursday. Massive uptrend the next day as the asset peaked at $0.53 and closed with a positive change of more than 5%. It tested $0.55 but failed to flip it on Sunday.
A look at indicators reveals that the current intraweek session may not be as rosy as the previous one. XRP was overbought last week. It may see corrections throughout the next five days as RSI dips below 60.
A clear look at the Moving Average Convergence Divergence shows additional information. We observed that the 12-day EMA intercepted the 26-day EMA a few hours before the time of writing.
It is important for the bulls to defend the $0.45 support as failure to do so will mean further downtrends. One of the two scenarios may play out. We may see prices linger between $0.45 and $0.43.
If a massive correction like the previous day’s takes place, XRP may sink as low as $0.40. The next tough support is at $0.36. Nonetheless, if the coin picks up momentum, it may resume it uptrend and gain stability above $0.50.
MKR/USD
Maker had a very good start to the previous week. On the first day, it gained more than 7% after it peaked at $818. On Tuesday, the asset saw more price increase as it peaked at $885 but retraced as it experienced strong resistance at its peak.
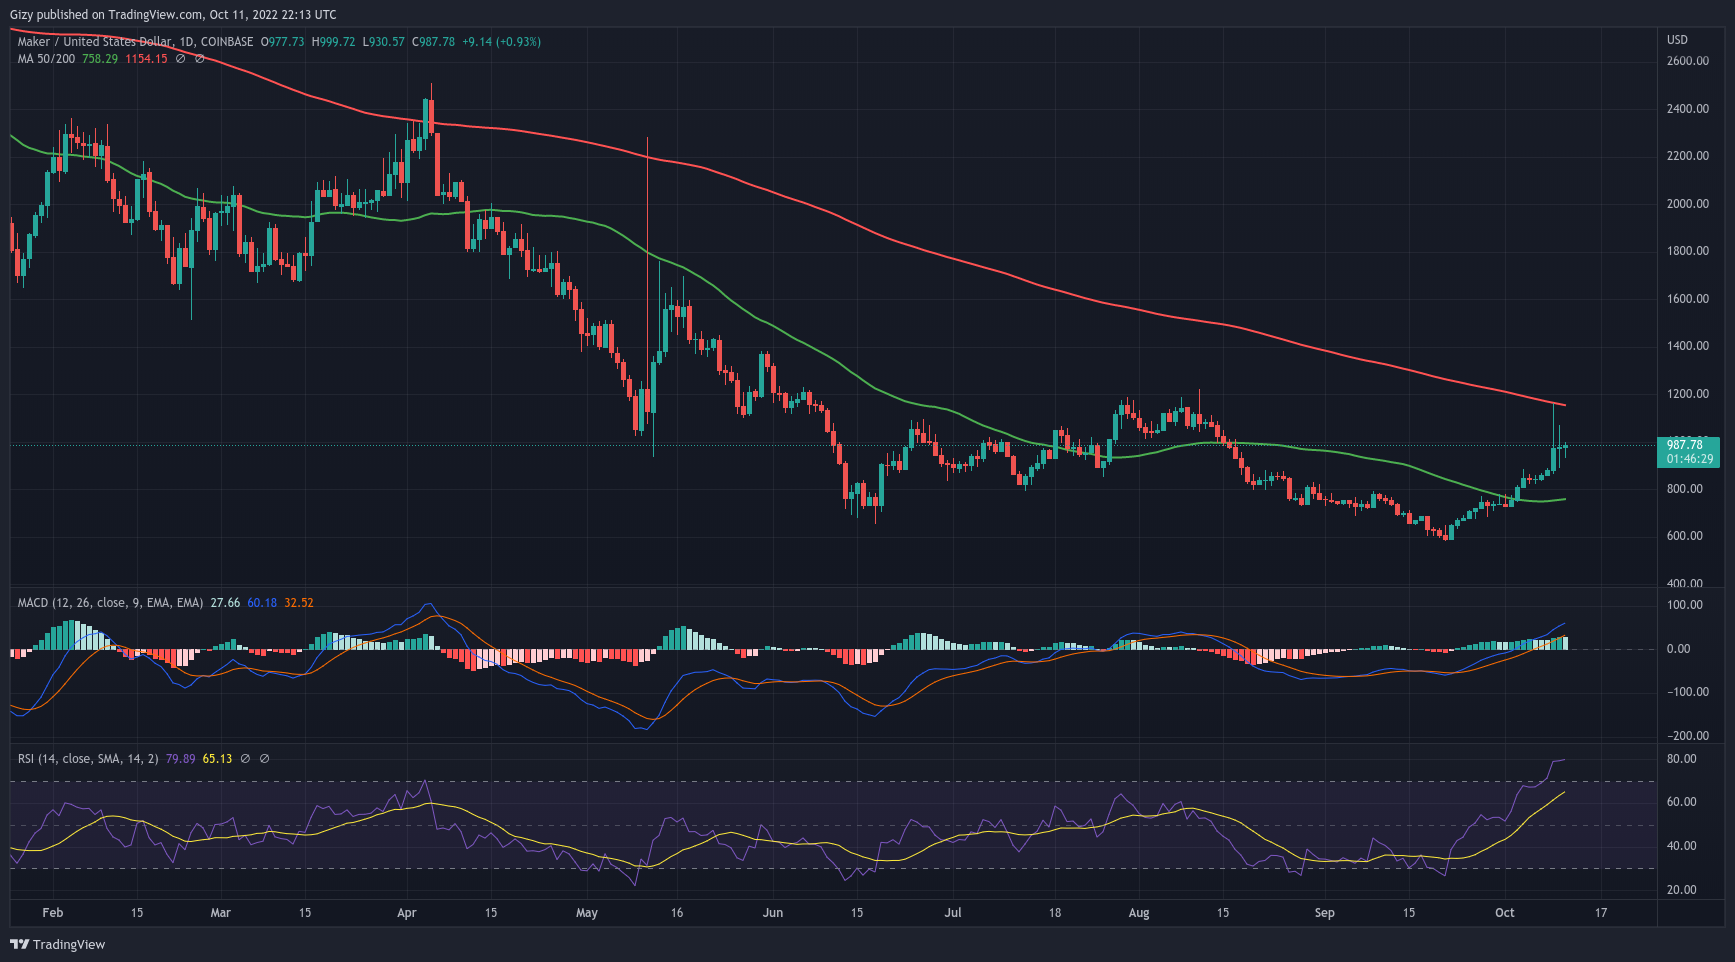
Nonetheless, it recorded gains exceeding 3%. The next few days were marked with low trading volumes as we observed little lines on the daily chart. A breakout from this trend took place on Sunday.
MKR surged as high as $1,162. However, it experienced stiff resistance that saw it retrace to a close at $973. It ended that intraday session with gains exceeding 10%. On the weekly chart, the token closed with a positive 28%.
Every indicator was bullish in response to the massive increase. For example, the Relative Strength Index peaked at 80. MACD’s 12-day EMA also surged above 0. With both indicators seeing such a massive trajectory, we may conclude that the asset will see massive price changes this week.
Price actions during the previous intraweek’s session hinted at massive volatility. Nonetheless, we bear in mind that MKR is overbought. RSI rules dictate that such asset is bound to see corrections.
If that happens, it may revert to its week-old support at $800. On closer inspection, we also note a significant demand concentration at $870. On the flip side, we may see a retest of the $1,200 resistance.
CSPR/USD
Casper price action during the previous intraweek session had a lot of bullish moments. It saw a positive change in price worth more than 3% on the first day. The biggest highlight of the week happened on Thursday.
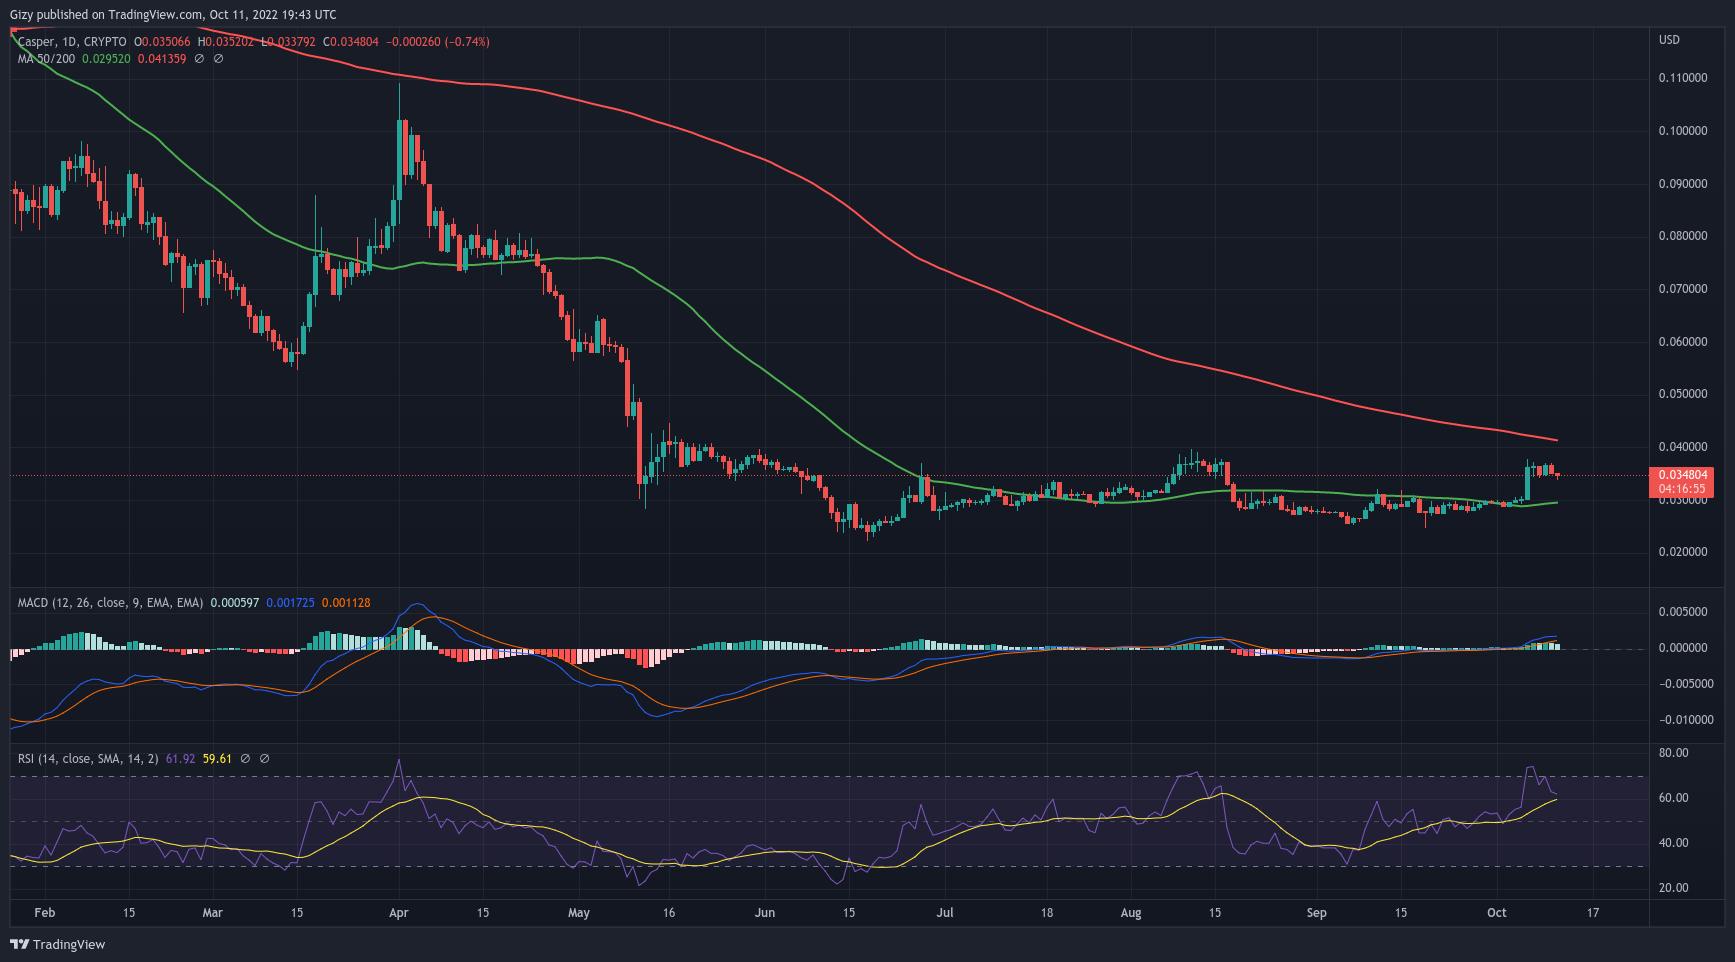
The coin open at $0.030 and peaked at $0.037 but closed a little lower with gains of almost 20%. Following this massive increase, CSPR marked the last three days of the session with an equal amount of downtrends and uptrends.
On the weekly chart, the asset gained more than 27%. One interesting action that may determine price action this week was a close at 70. It was overbought but corrected and back to the boundary due to recovery.
CSPR may experience massive retracements over the next five days. Affirming this claim, we observed that the cryptocurrency lost 4% yesterday. Further price decrease today. One key level to watch is the $0.033 support. Failure to keep this level may result in a further decrease below $0.030.