


Most cryptocurrencies to watch last week failed the bullish expectations of traders. For example, Dogecoin failed to end the previous week with any notable gains or losses. Nonetheless, its movement was according to predictions in a weekly outlook.
The article stated that the asset would retest the $0.15 resistance. It also added that it may sink as low as $0.10 once it loses momentum. We observed that it tested the $0.15 barrier and sank as low as $0.11 after rejection. It is currently holding the $0.10 support.
Shiba Inu also had a similar experience to DOGE as we failed to impress and ended the week with no significant losses or gains. This is also the current state of the global cryptocurrency market cap.
It started the previous intraweek session at $1.01 trillion. However, it closed at $1.05 with no strong increase. Many worry that this may spell the start of another sideways trend. Nonetheless, the sector is seeing more movement at this time.
Most cryptocurrencies in the top 100 are down by a few percent. The global cryptocurrency market cap is also down by almost 3%. Recall that this was the same trend two weeks ago and the sector recorded massive increases. Will the same event take place over the next six days?
Top Five Cryptocurrencies to Watch
BTC/USD
Bitcoin’s performance during the previous intraweek session was one that many would describe as void of volatility. The first three days of the week were one of the dullest as the assets under consideration failed to record any notable losses or gains.

However, it was represented by red candles, indicating little losses during the period. It registered its first green on Thursday. Nonetheless, it was the tiniest candle on the chart as it looked more like a line with no wick extending from it.
It saw its biggest move for the week on Friday as the top coin gained more than 4%. It climbed above $21k to the delight of the bulls. The last day of the session under consideration was marked with a little downtrend.
On the weekly chart, the apex coin failed to record any notable increases or losses. Nonetheless, it closed with a little improvement in price. A look at indicators on a daily scale tells us more about how prices performed over the last seven days.
We observed the start of a bearish convergence with the 12-day EMA dipping to its lowest on Wednesday. It recovered the next day and the danger was averted. BTC continued trading above its 50-day Moving Average during the previous intraweek session.
The new week is kicking off with a few losses. The Moving Average Convergence Divergence is raising concerns as we noticed a downtrend on the 12-day EMA. The following scenarios may play out over the next six days.
BTC may trend sideways throughout the period under consideration. On the other hand, there are indications of massive price movements. This will happen in a bid to prevent a bearish divergence or in response to one. The $18k support may flip if bitcoin experiences a divergence within the next six days.
ETH/USD
Ethereum’s performance last week was one that many never expected. The first three days of the intraweek session were mixed with both bullish and bearish sentiment. On Monday, it peaked at $1,635 but dipped to a low of $1,525.
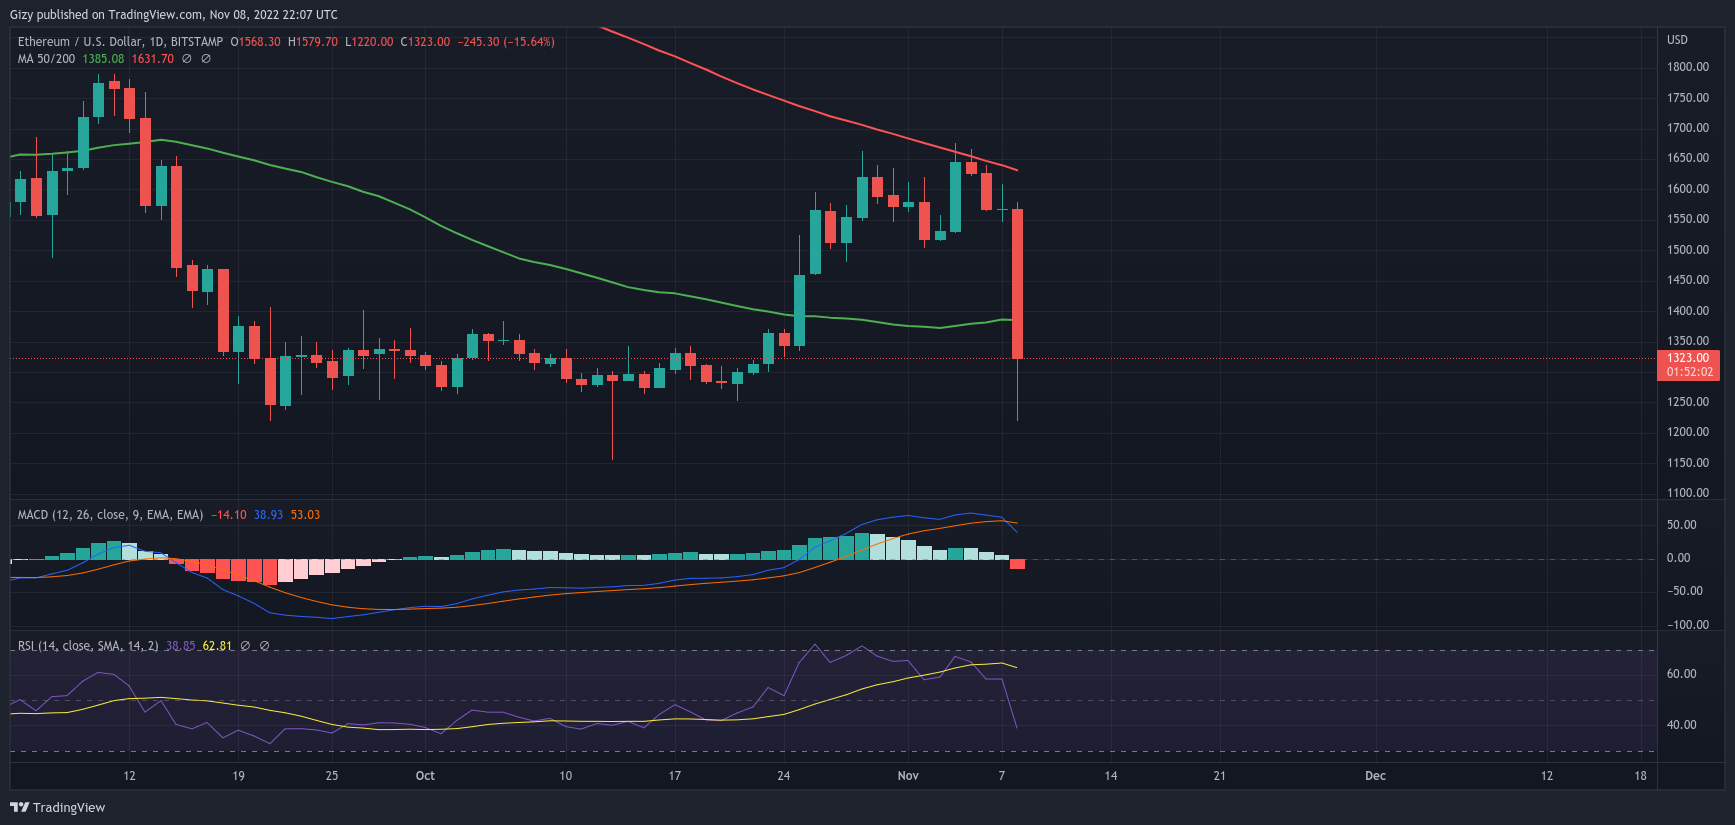
It closed with no notable gains or losses. The next day was marked with very little volatility as the largest altcoin by market cap failed to attain any significant highs or lows. This changed on Wednesdays as it lost more than 3%.
It had its biggest surge on Friday. It opened the intraday session at $1,531 and peaked at $1,678 and closed at $1,645. It closed, with gains exceeding 7% as trading volume increased. This marked another push by the bulls to break key levels.
The last two days of the week were marked with little downtrends. It lost more than 4% during this period. As the period under consideration neared its end, several indicators were hinting at massive retracements.
A look at the Moving Average Convergence Divergence further amplified the impending decrease. The 12-day EMA is dipping by and may intercept the 26-day EMA. This may become a divergence in the coming days.
This is exactly what we are seeing in the current week. The previous intraday session was marked with no notable gains or losses. The current 24-hour period is taking a different turn as ETH is seeing one of its biggest downtrends of the month.
The asset is currently down by more than 15% after a dip to $1,220. The prospect of the coin is bleak as there is so much uncertainty at this time. Nonetheless, following the massive downtrend, we may expect a corresponding buyback.
One of the levels to watch over the next five days is the $1,400 resistance. It may regain this mark and use the barrier for major price rallies.
MATIC/USD
Polygon had one of the biggest surges since July. On the weekly chart, it gained more than 24% with a lot of action during the week. However, it started a little slow as it failed to record any notable increases or losses on Monday.
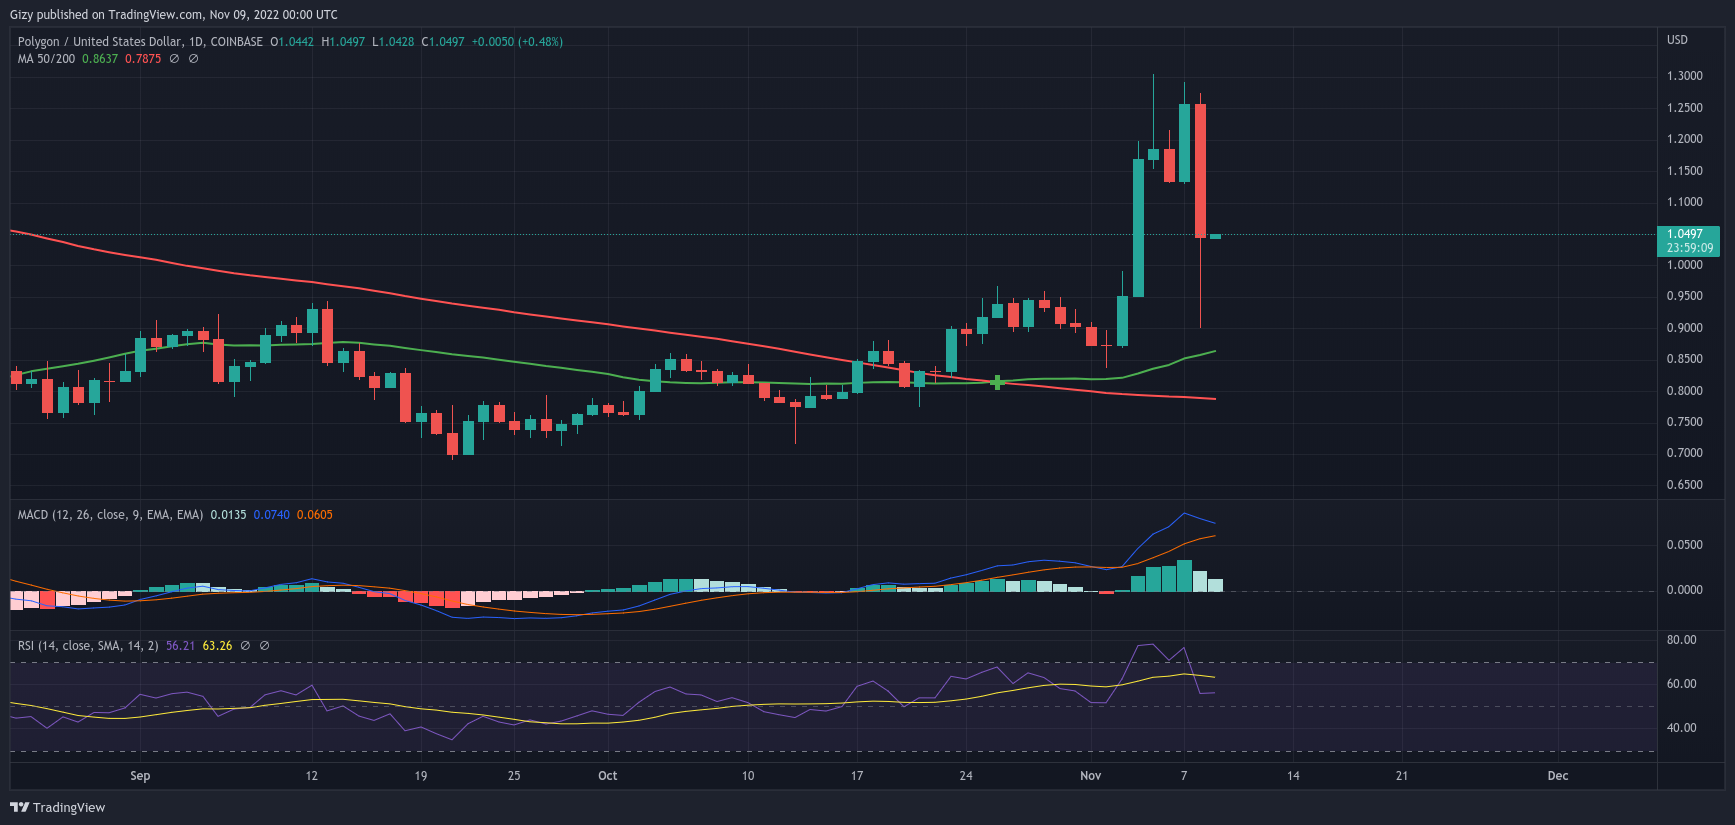
There was a change to sentiment the next as trading volumes improved. It closed with losses of more than 3% as the bearish dominance bit harder. MATIC dipped to the lowest for the intraweek session as it dropped to a low of $0.83.
It rebounded and reclaimed its opening price. Thursday marked the start of the uptrend as it made an attempt at the $1 resistance but failed to flip due to rejections at $0.99. Nonetheless, it ended the session with gains exceeding 8%.
Friday came with more price increases as the asset under consideration flipped the highlighted barrier. It aimed at retesting $1.20 but failed in its bid as it retrace to close at $1.16. It also saw a positive change of more than 20%.
$1.20 fell to superior pressure during the next intraday period as polygon peaked at $1.30. As with previous highs, it dipped. However, it failed to record any notable losses or gains. A look at the indicators raised concerns.
The altcoin was oversold as it hit a high of 77. This was also the reason for the price action on Saturday. Many feared a massive downtrend during the current week. Price movements on Monday increased this concern as the Relative Strength Index returned to its peak.
The current intraday session is bringing normalcy back to the market as it is below 70. Nonetheless, there are risks of the asset becoming oversold. Like most cryptocurrencies to watch, MATIC must hold to a key level; the $1 support. A flip of this mark may have a cascading effect on other barriers.
LTC/USD
Litecoin is another cryptocurrency to watch this week. A look at the daily chart says that the asset under consideration was mostly bullish during the previous intraweek session. A closer look showed that it had five greens with notable price changes.
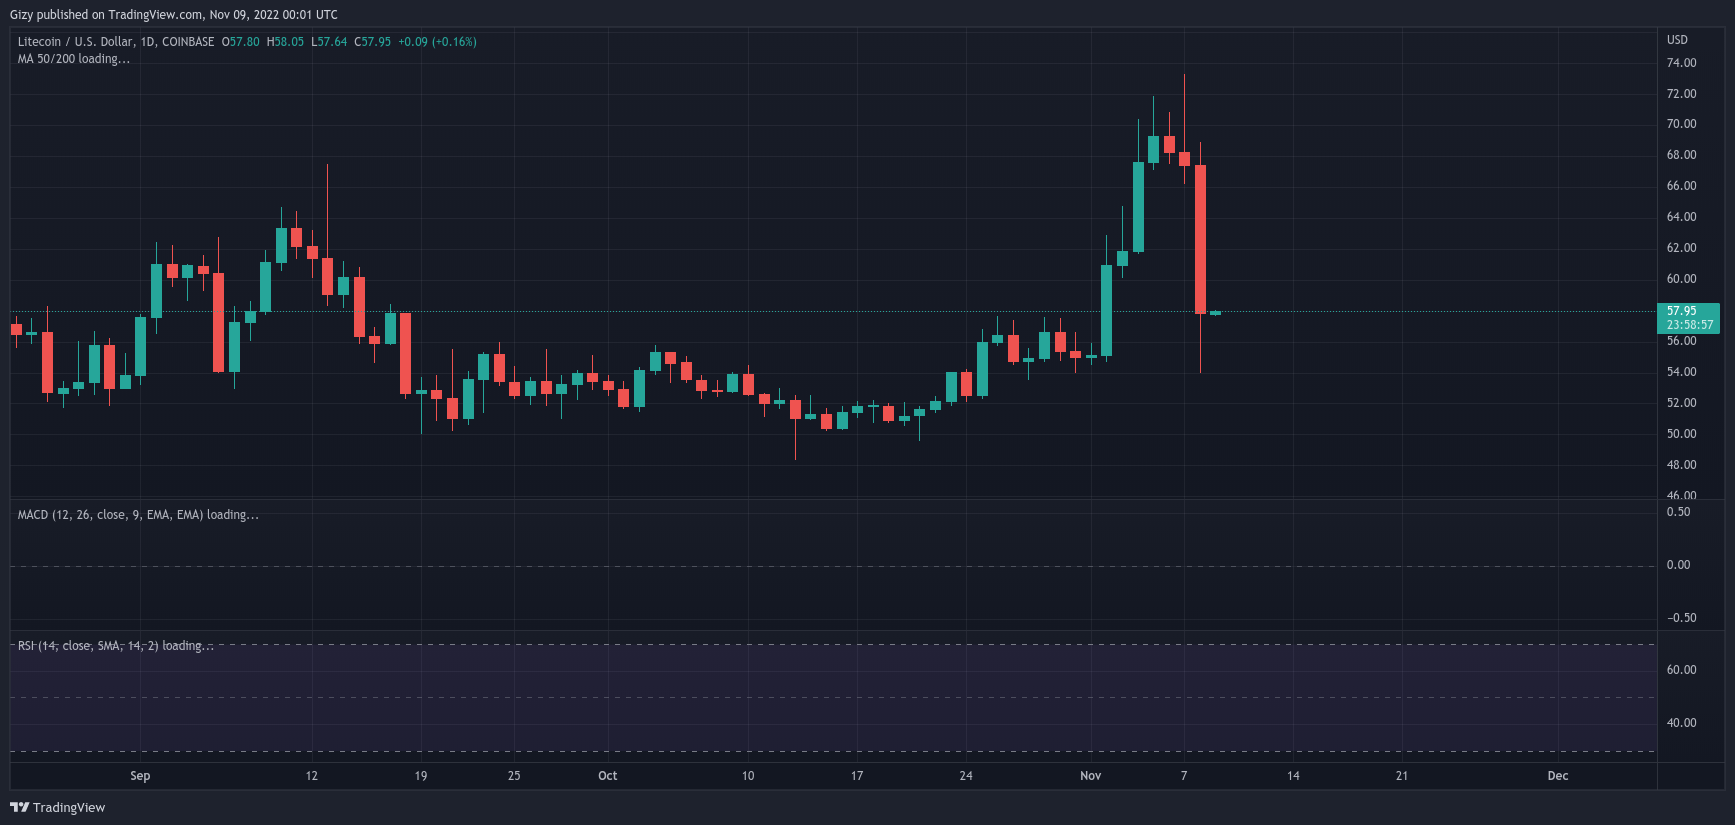
It started after low trading volume on Tuesday that ended with very little change. Wednesday was different, as we observed a more than 10% increase after a retest of the $60 resistance. The massive increase in buying pressure reflected in RSI as it ended the session at 70.
Further increases made LTC overbought. The next day it experienced a further push that ensured more stability above the 200-day Moving Average. However, it closed with no notable losses or gains.
For the first time since May, the altcoin tested another key level. It tested the $70 resistance. It ended the period with gains of more than 9%. We noticed further attempts at stability above $70. The last day of the session under consideration was a red.
Nonetheless, on a weekly scale, it closed with gains exceeding 20%. Like most cryptocurrencies to watch, it ended the previous week overbought, which may spell massive retracements for the asset over the next five days.
This may explain the sudden drop in momentum on Monday as the altcoin peaked at $73. It also ended the period with no notable losses or gains. Nonetheless, it is experiencing one of its biggest losses of the year during the current intraday session.
The massive downtrend dipped by more than 14%. It saw a low of $54 but rebounded and exchanged at $57. The question on everyone’s mind is if this is the end of the price decrease. A look at RSI suggests that the worst may be over.
It is currently at 49 which means the asset may see a buyback within the next few days. This may guarantee a retest of the $60 resistance.