TON Price Analysis of March 11, 2025: Toncoin Recovered from $2.354 and Eyes to Spike over $2.623 Resistance?
Let’s Dive into the TON Price Analysis of March 11, 2025, to understand TON's market trends and investment potential in 2025.
Author by
News Room

Are you tracking the TON price today to catch the next big move? TON price analysis highlights a volatile market, with the price swinging between key support and resistance levels. Over the past 24 hours, the market has seen a breakdown, a strong recovery, and a potential breakout, making traders cautious. TON price prediction suggests that if the price sustains above resistance, it could fuel further gains. However, failure to hold this level may trigger another pullback. With shifting momentum and crucial technical signals, let’s explore the latest price action and what it means for TON’s next move.
TON Price Struggles After Breakdown at $2.623 Support
The trading day of March 10 began with an upward trend fueled by the previous day’s golden cross. The price established support at $2.623 before experiencing another golden cross on the MACD line at 9:05 UTC. With an overbought RSI situation at 9:20 UTC, the price climbed further, eventually reaching resistance at $2.805 by 11:50 UTC. A shift in momentum occurred at 12:25 UTC when a death cross on the MACD line initiated a downward channel.
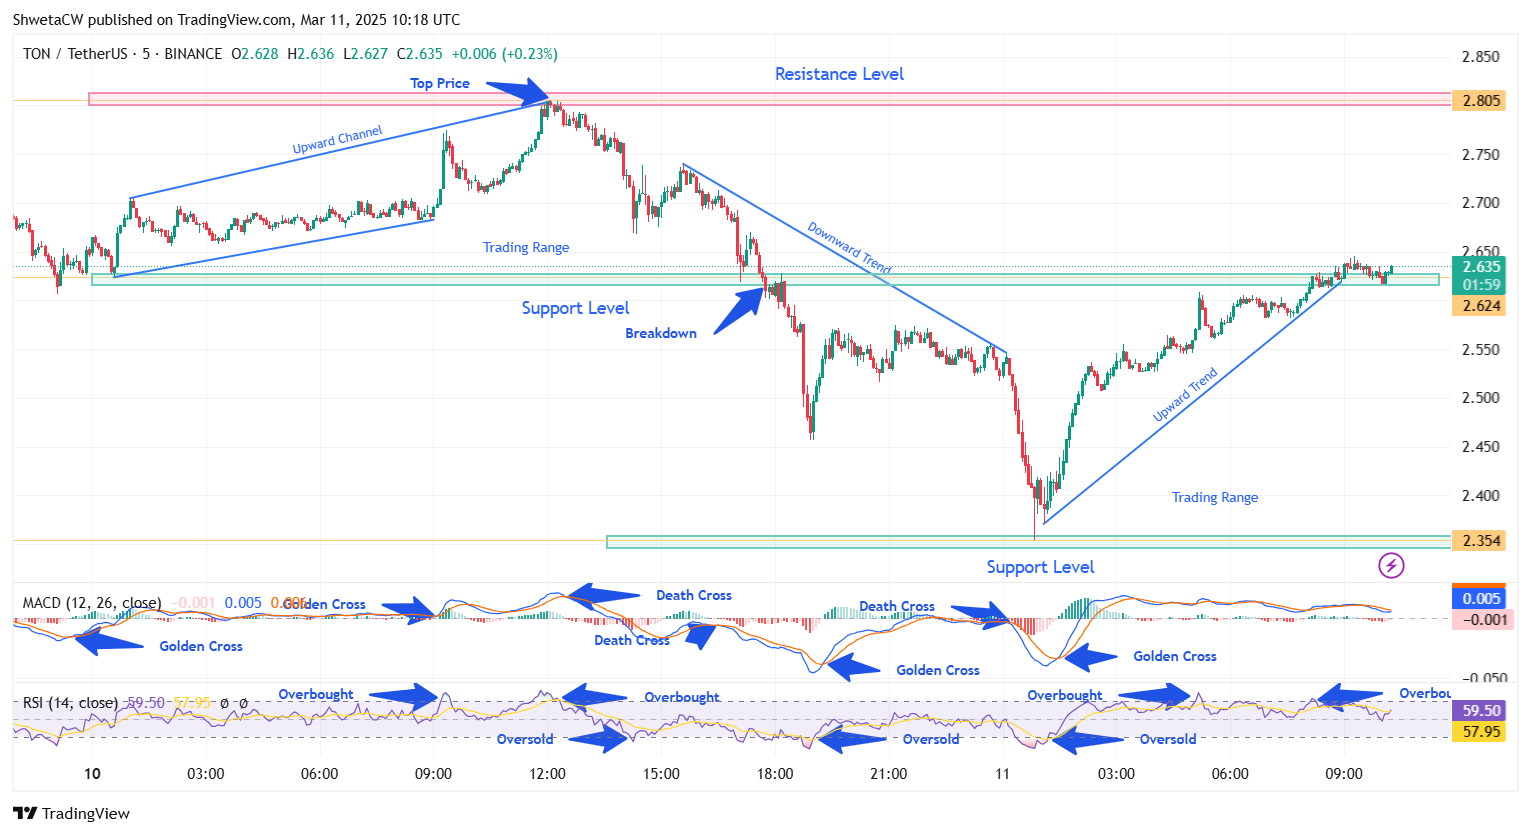
Chart 1, Analyzed by ShwetaCW, published on TradingView, March 11, 2025
The selling pressure intensified as an oversold RSI reading at 14:50 UTC pushed the price lower. A subsequent death cross at 16:20 UTC triggered a breakdown, forcing the price below the previous support. The RSI indicator remained in an oversold zone from 17:00 UTC to 19:00 UTC, causing further declines and turning the prior support into resistance. At 19:20 UTC, an upward move was suggested, leading to price fluctuations within a defined trading range. Despite moderate recovery attempts, the price struggled to regain its bullish momentum, closing the session within a consolidation phase.
TON Price Analysis of March 11: Sharp Drop, Breakout, and Recovery
The trading day of March 11 started with a death cross, triggering a sharp decline. The RSI indicator showed an oversold condition at midnight, where the price found support at $2.354. A golden cross on the MACD at 1:25 UTC initiated an upward trend, pushing the price higher. Momentum strengthened, and by 5:10 UTC, the RSI signaled an overbought condition. The price attempted to break resistance but struggled, leading to another overbought situation at 8:10 UTC. The key question now is whether this breakout will hold or turn into a false breakout, determining TON’s next direction.
TON Market Prediction: Breakout or Reversal?
TON price analysis shows a mix of volatility and key levels shaping the market. Over the past 24 hours, the price moved through a downward channel, experienced a breakdown, and then formed an upward channel, suggesting a potential breakout. If the upward trend holds, the TON price today could break above the $2.623 resistance and re-enter the previous trading range, targeting $2.805. However, if the breakout fails, the price may retreat, testing support at $2.354. With TON price prediction signaling uncertainty, traders should watch for confirmation of the breakout before making their next move.

News Room
Editor
Newsroom is the editorial team of CoinfoMania, delivering 24/7 crypto news, market insights, and in-depth analysis. With 30+ journalists worldwide, we keep you ahead in the blockchain space.
Read more about News RoomRelated Posts

Ripple News: Hidden Road Deal Sets XRP Up to Kill SWIFT — Are You Ready?
News Room
Editor

Solana’s $150 Potential: How Today’s Revenue Trends Are Setting SOL Up for Massive Gains?
News Room
Editor

Ripple’s FINRA Breakthrough Could Skyrocket XRP Price – CEO Brad Garlinghouse Weighs In
News Room
Editor
Loading more news...