SUI Price Analysis of March 12, 2025: SUI Recovers from $2 Dip, Aiming to Spike over $2.3 Next
Let’s Dive into the SUI price analysis of March 12, 2025, to understand SUI’s market trends and investment potential in 2025.

Are you considering investing in SUI and have been researching its prices? As SUI goes through a volatile phase, making an investment choice becomes challenging. To make that easy for you, this article will discuss the SUI price analysis for March 12 in detail, examining possible SUI price trends and making forecasts about the possible opportunities for the day. In the last 24 hours, SUI has seen some recovery from its months-long low of $1.97, meeting strong support at key levels.
SUI Price Analysis of the Last 24 Hours
SUI started the day at $2.10, eyeing to break out of a trading range that started late on the previous day. The breakout did occur, with a death cross at midnight, as SUI went down to $1.96 by 01:50. However, a significant golden cross at 01:20 called for a strong reversal. An upward trend started forming, with SUI slowly reaching $2.20 by 06:15 UTC. At that point, the price was observed entering into a trading range, with both the EMAs almost coinciding. The price alternated between $2.16 and $2.21 resistance. SUI spent about six hours in this trading range, touching the resistance on occasion and waiting for a breakout.
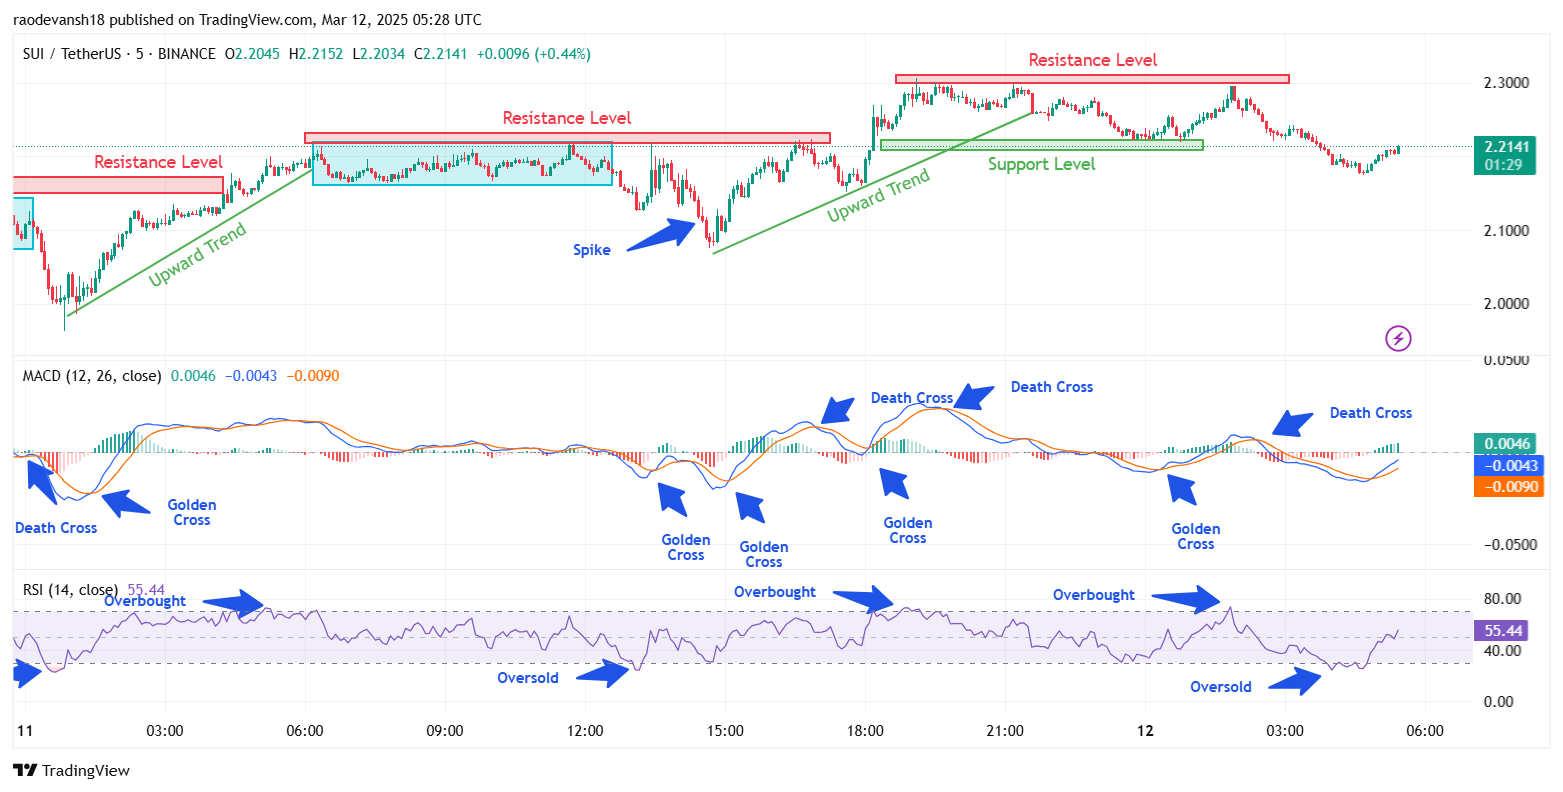
Chart 1, analyzed by raodevansh18, published on TradingView, March 12, 2025
The breakout, much like the previous trading ranges, occurred in a downward direction. Marked by a slight death cross at noon, the price fell to $2.12 by 13:15 UTC, with an oversold RSI. Rapid action followed on the MACD, with a golden cross and a death cross in quick succession, as the price spiked back to $2.21 and returned to $2.13, all within an hour. The Death Cross took the price further down to $2.07. At 15:05, the shorter EMA again overtook the longer one, and an upward trend began. The trend would lead SUI to again touch the $2.21 resistance level at 16:35 UTC and return.
Soon, the short-term EMA took the lead, and a correction was noticed. The price decreased to $2.16. The overall uptrend persisted, with a golden cross at 18:00 sparking a quick surge as SUI hit $2.26 by 18:10. It broke past the $2.21 resistance, climbing steadily while the RSI entered the overbought territory. SUI peaked at $2.30 before a death cross on the MACD at 19:40 pulled it down to $2.22 support by 23:50 UTC.
SUI Price Predictions: What’s In The Works For SUI Price Today
A golden cross early on in the day looked promising, upping the prices. But the $2.26 resistance sternly rejected its approach once again as a downtrend started. The downtrend was confirmed by a death cross at 02:20 UTC. In the last update for March 12, SUI seemed to be approaching the $2.22 support.
Based on the SUI price prediction, SUI seems set to breach the $2.22 support. In the coming hours, a trading range could be in the works around a new support level. Depending upon which direction SUI breaks out of the trading range, different repercussions could be observed. If SUI has an upward breakout, it could be met by a correction phase before forming another trend. However, any downward movement would result in the formation of a new support and a strong resistance somewhere near the current support levels.
SUI Price Analysis: Day Dominated By Trends
The previous day was marked by several gradual trends, and the movements for SUI price today may not be too different. As SUI steers clear of the $2 mark, bullish sentiments could lead it further upward. However, it remains to be seen if the momentum will be sustained or characterized by ‘down’ days during the ascent.
Follow us on Google News
Get the latest crypto insights and updates.


