Solana Price Analysis of March 4, 2025: SOL Rejection from $180 Resistance Led to $132 Crash
Let’s Dive into the Solana Price Analysis of March 4 to understand SOL's market trends and investment potential in 2025.

Monday’s recovery attempt wasn’t enough to sustain momentum, as Solana price analysis shows a renewed decline. SOL price today is facing strong resistance, making it difficult to hold key support levels. Despite brief bullish attempts, increasing selling pressure has pushed Solana lower, signaling that bears still dominate the market. With liquidity shifts and technical signals shaping price action, traders are now monitoring the next key support zone. Let’s analyze the past 24 hours of market movement and explore the Solana price prediction for the next move.
Solana’s Price Battles Resistance – Will It Recover or Fall Further?
The trading day started with a downward trading range, following the impact of the previous day’s death cross. SOL’s price faced resistance at $179.48, preventing any immediate recovery. The price continued to fluctuate within a moderate downward trend, and an oversold RSI signal at 2:35 UTC added more selling pressure. By 6:00 UTC, another death cross on the MACD pushed the price further down, with another oversold RSI confirmation at 6:35 UTC. At 8:50 UTC, the RSI once again signaled oversold conditions, causing a sharp decline to the support at $156.86. However, at 9:20 UTC, a golden cross on the MACD suggested a potential recovery, initiating an upward trend.
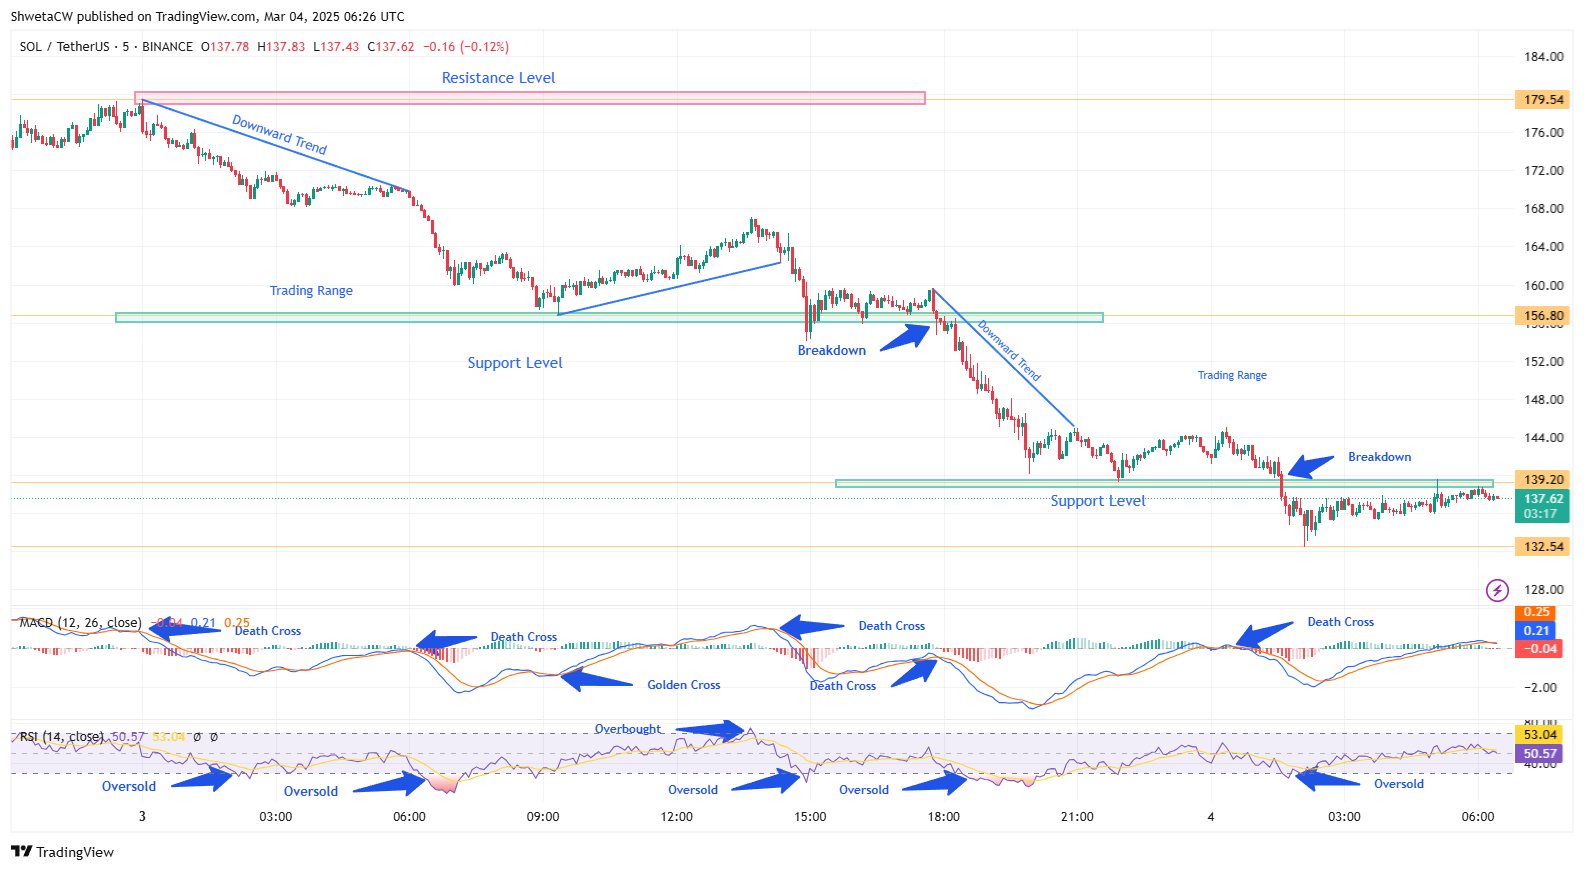
Chart 1, Analyzed by ShwetaCW, published on TradingView, March 4, 2025
This attempt at bullish momentum was short-lived, as another death cross at 14:40 UTC led to a renewed downward channel. At 14:00 UTC, oversold RSI conditions forced SOL to break its support level, though the price tried to hold. Another death cross at 17:50 UTC triggered a deeper breakdown, with oversold RSI signals between 18:30 UTC and 20:00 UTC confirming bearish control. The price continued its downward move, eventually finding new support at $139.23 after another RSI oversold signal at 21:55 UTC. The day ended with moderate price fluctuations within this new trading range.
Solana Drops to $132.50 Before Attempting Recovery
The trading day of March 4 started with a downward trend as a death cross at 00:30 UTC signaled bearish momentum. At 1:35 UTC, a breakdown occurred, pushing the price below its support level. The oversold condition on the RSI at 1:45 UTC confirmed the sell-off, with SOL finding temporary support at $132.50. However, at 2:30 UTC, a golden cross appeared, suggesting a potential reversal. Following this, the price started moving in an upward trend, but overall momentum remained uncertain as traders watched for the next decisive move.
Solana Struggles to Hold Support – What’s Next?
As Solana price analysis suggests, over the past 24 hours, Solana’s price analysis highlights a volatile market with a recovery attempt followed by multiple breakdowns. If the SOL price today breaks the current resistance at $139.23, previously a support level, this move could result in a false breakout, bringing the price back into the $156.86 trading range. Alternatively, if selling pressure continues, SOL may fail to reclaim resistance, leading to a decline below the current support of $132.50. Traders now watch for key signals to determine the next move. Solana price prediction remains uncertain as the market struggles to establish a clear direction.
Follow us on Google News
Get the latest crypto insights and updates.
Related Posts

Binance.US Lists AI-Created Meme Coin TURBO Amidst 140% Monthly Surge
Triparna Baishnab
Author

Justin Sun’s SpaceX Visit and Viral Tweet Ignite TRX and DOGE Market Surge
Triparna Baishnab
Author

Ethereum’s Pectra Upgrade Advances PoS Transition, Enhancing Scalability and Smart Contract Flexibility
Triparna Baishnab
Author
Loading more news...