SHIB Price Today: Breakout at $0.00001380 Led to 10% Drop to $0.00001250
Let's delve into the SHIB price today and understand how the steady downtrend was already indicated with the SHIB technical analysis on March 4, 2025.

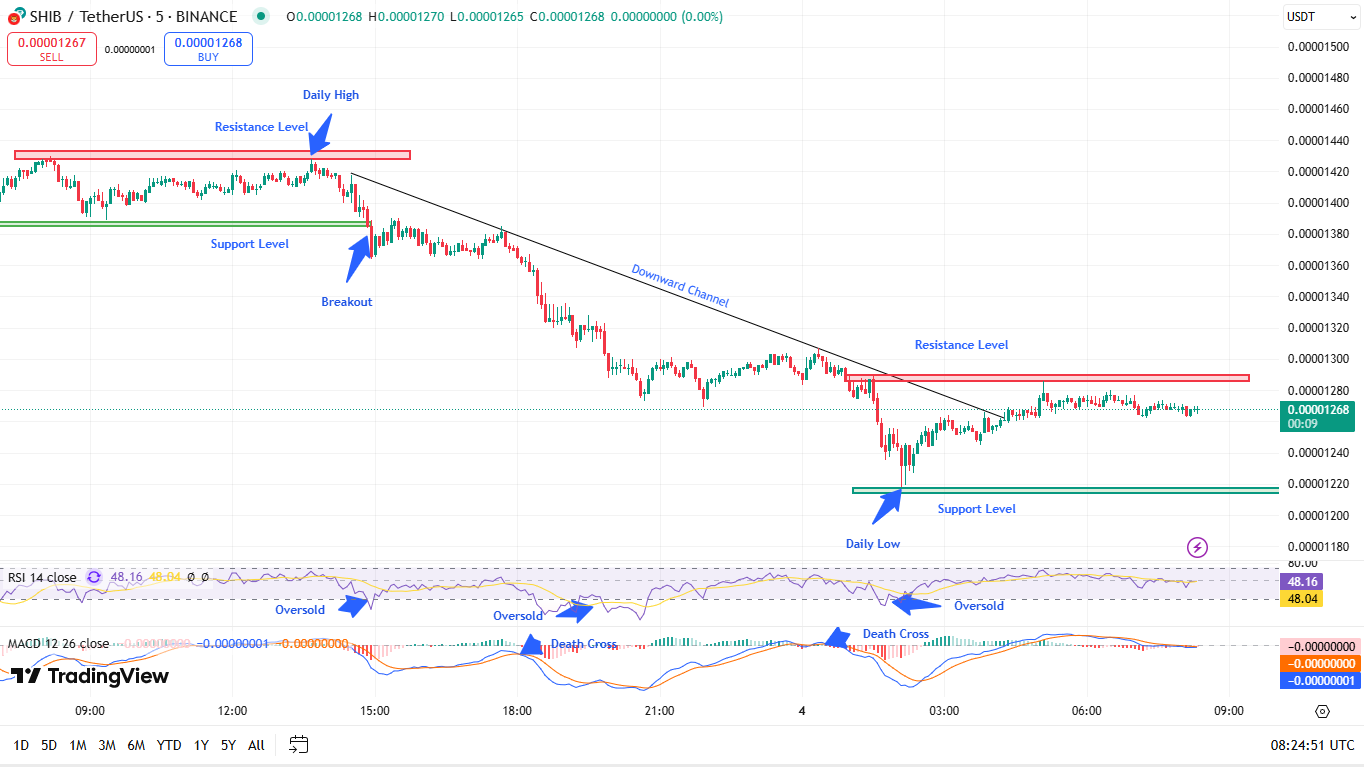
Are you looking to invest in SHIB and wondering if it can give you profits at this time? The SHIB analysis would be an insightful way of understanding the risks related to this investment. The SHIB price today showed a major price fall when it reached a resistance level of 0.00001300 USDT. An ascending price channel formed as the price moved downward and reached a daily low point reaching 0.00001220 USDT. The evaluation reveals resistance areas along with support ranges as well as RSI and MACD tools alongside potential price changes.
Analyzed by baishnabtriparna, published on Tradingview on March 4, 2025
The SHIB price trend demonstrates a major resistance, which exists at 0.00001300 USDT. The price tested at this resistance level multiple times until SHIB eventually transitioned into a bear market. The red selling zone demonstrated strong resistance at this point which makes SHIB challenge to stay above this resistance boundary. The price of SHIB received powerful backing at 0.00001220 USDT while establishing its daily low. The price received crucial support from purchasing activities which activated the buying pressure to push the price higher during the specified support zone.
The price declined through a downward channel pattern because it established successive lower highs and lower lows. At 03:00 UTC, the resistance pattern brok,e thus allowing a brief market increase to occur. The temporary breakout attempt at this downtrend failed after it performed only briefly before the price returned to its declining trend. The bearish trend is indicated by the downward channel, while the breakout attempt served as an evaluation of trend strength.
Indicators in SHIB Technical Analysis
The Relative Strength Index (RSI) dipped below 30 multiple times, confirming oversold conditions. These oversold signals appeared at 15:00 UTC, 21:00 UTC, and 03:00 UTC, each followed by a slight rebound. The RSI is a crucial indicator in SHIB technical analysis, providing insights into potential buy and sell signals. The oversold conditions indicate that the price may be due for a bounce or a reversal.
The bearish momentum persisted because Death Cross signals emerged near 18:00 UTC and then again at 03:00 UTC. The relationship between the MACD line and the signal line remained negative since most of the trend duration exhibited selling pressure signatures. The SHIB price trend requires MACD signals and Death Cross readings for traders to make well-informed trading decisions. The MACD indicator functions as a valuable instrument for watching market trends together with their potential turning points.
Future Scope: What’s Next for Shiba Inu?
Two forecasted situations arise from SHIB’s present market movement patterns. If SHIB succeeds in maintaining above 0.00001300 USDT, the price will likely target resistance levels at 0.00001350 USDT. SHIB has a bearish outlook when it does not surpass 0.00001300 USDT while entering a downward movement, potentially reaching the support area at 0.00001220 USDT by declining further. Price scenarios in the future will depend on how strong the current trend is, together with the potential strength of price breaking through important resistance levels.
The bearish trend remains dominant, with SHIB showing signs of temporary support but facing strong resistance at 0.00001300 USDT. Traders should watch for a clear breakout or breakdown confirmation before making directional moves. Stay up-to-date with the latest SHIB price today and SHIB technical analysis to make informed trading decisions.
Follow us on Google News
Get the latest crypto insights and updates.