SHIB Price Analysis of March 10, 2025: Shiba Inu Recovered to $0.00001240 after $0.00001240 Crash, Will Bullish Momentum Continue?
Let’s dive into the detailed SHIB price analysis of March 10, 2025, and understand investment scope and profit probability.

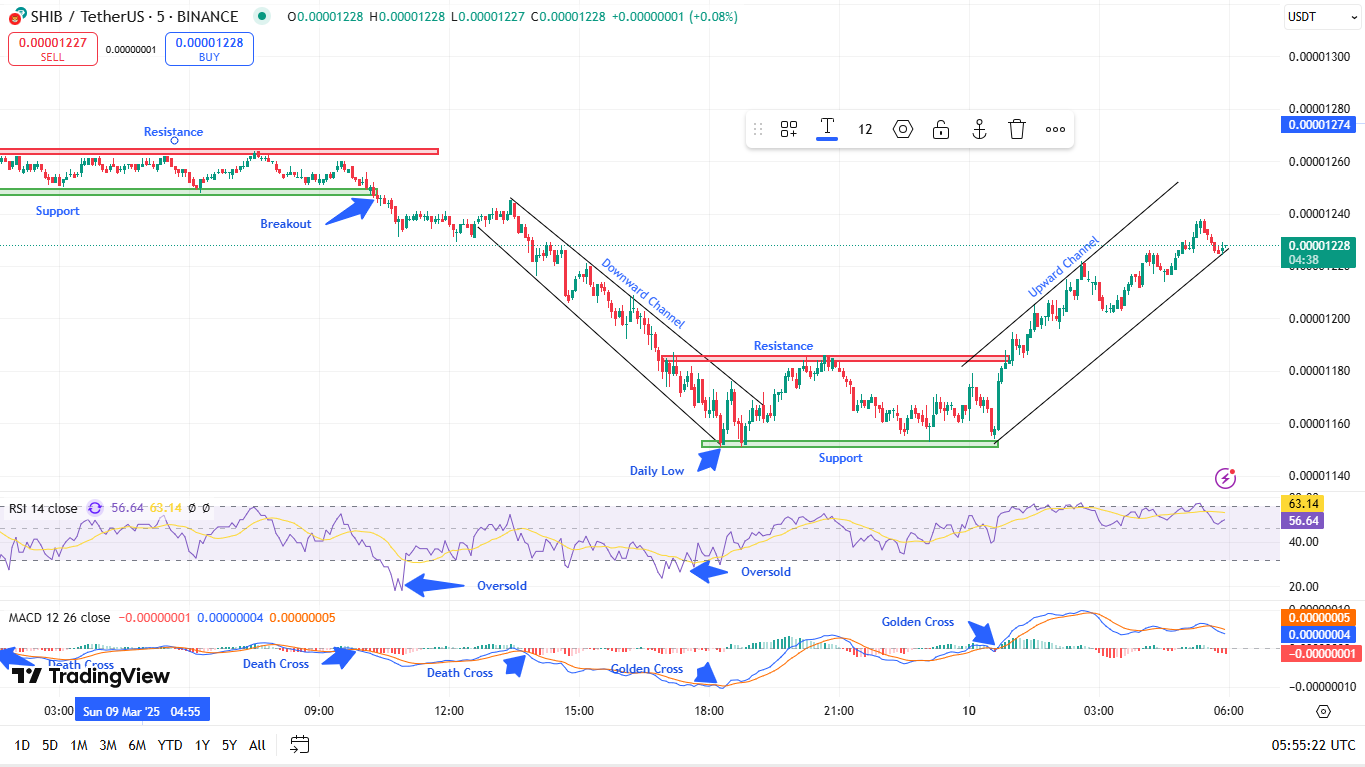
Are you wondering if investing in SHIB is the right decision to make at this point? As of March 10, 2025, the Shiba Inu price trend has displayed dynamic price movements transitioning through various phases, including breakouts, downward trends, and eventual recoveries. The SHIB price analysis indicates that the price consolidated within a defined range, thereby facing strong resistance before experiencing a breakout that led to a sharp decline. This downward move resulted in the formation of a downward channel, eventually reaching a daily low. However, after testing this critical support level, the price rebounded, forming an upward channel that signals a potential trend reversal.
Analyzed by baishnabtriparna, published on TradingView on March 10, 2025
Shiba Inu Price Trend: Downward and Upward Channels
Based on SHIB price analysis, SHIB formed essential resistance and support areas, which bound its price fluctuations. The price point at $0.00001280 has proven itself to be an effective barrier that restrains bullish price movements. A break below earlier support levels triggered a quick price decline that concentrated the price at the $0.00001160 support level. After the market reached $0.00001180 during its previous resistance level, it transformed into a support zone because investors started buying. The moving support and resistance levels may signal that market participants are stockpiling before generating a significant market change.
The price movement also highlighted two major trend structures: a downward channel, where the asset experienced consistent lower highs and lower lows, and an upward channel, which followed a successful rebound from the daily low. The transition between these two channels suggests a shift in market sentiment, with bearish exhaustion leading to increased buying interest and a potential trend reversal.
SHIB Price Analysis: Bullish Momentum and Potential Reversal
The Relative Strength Index (RSI) offered essential information about market momentum strength together with points for potential market reversals. A price recovery of SHIB became likely because the RSI dropped into the oversold zone during the initial downtrend. The current RSI value of 63.14 shows bullish strength that is near the overbought territory. An RSI level exceeding 70 indicates that the currently traded asset is likely overbought, which potentially creates space for short-term price corrections or pullbacks. Observing RSI metrics helps investors determine how well the price increase can continue forward and when to expect price reduction signals.
The MACD indicator analyzed trend shifts and momentum strength effectively throughout the analysis period. Bears exerted control throughout the monitored time frame due to the frequent death crosses that formed. Price declines and buyer weakness were confirmed by the MACD death crosses, which occurred when the main MACD line fell under the signal line. The price recovery phase brought the emergence of golden crosses which indicated changing market momentum into bullish direction. A new appearance of a death cross signifies weakening momentum, which could indicate another bearish movement even though the recent golden cross indicates continued upward potential. The future trend confirmation depends heavily on the relationship between MACD signals for the next trading period.
SHIB Price Today: Potential Scenarios-Breakout, Pullback, or Reversal?
The SHIB price could rise toward $0.00001300 and beyond when the bullish momentum persists to break through the $0.00001280 resistance barrier. Extended price moves above $0.00001280 would validate buying demand which supports an ongoing bull market. The price may experience a retracement to either $0.00001200 or $0.00001180 because traders will seek to capitalize on their gains when resistance maintains its strength and the RSI moves into overbought conditions. Market sentiment shifts towards negative territory with a new death cross on MACD as the price extends towards its former support levels during such corrections.
Will SHIB’s Bullish Momentum Continue?
The SHIB price today shows market recovery as it struggles to recover from its recent major price drop and breaks through its daily low point. Strong buying momentum emerges in the market since RSI and MACD show bullish signs and an upward trend channel exists. A sustained bullish sentiment requires SHIB to surpass the essential resistance zone at $0.00001280 because this represents the crucial barrier to bull market sustainability. The market requires technical indications and price levels for traders to evaluate if an existing trading momentum will persist or transition into reversal mode. The upcoming several trading days will establish which direction the market will take.
Follow us on Google News
Get the latest crypto insights and updates.