


Ripple started the current week conceding notable losses. On Monday, it retraced from $0.53 to a low of $0.49, a more than 7% drop. The downtrend continued on Tuesday as it saw a low of $0.47. However, it failed to record any notable losses or gains.

We observed another doji on the chart which shows that both the bulls and bears are almost equally matched. An interesting thing about the current situation is that XRP descent is gradually slowing down.
It dipped as low as $0.47 today but bounced off the support. It may end in green doji. If such happens, this could mean the end of consistent decreases in price. The coin may experience a notable push within the next 24 hours.
Ripple may Reclaim $0.50
Based on previous price movements, the statement above may likely play out. We noticed that lately, the maximum span of red candles (consistent price decrease) is three days. There are also times when there were only two.
After this bearish period, the coin sees notable price increases the next day. The last two days were bearish. Following this pattern, we may expect the next intraday session to offer relief in terms of small improvements in price.

A look at the Relative Strength affirms this claim. From the chart above, we observed that since September 18, the metric did not fall below 56. We are also seeing the same thing play out now.
RSI halted its descent and is slowly picking up momentum. Taking this into consideration, we may conclude that XRP is gearing up for a massive rally like last week’s. During this bullish round, it will reclaim $0.50.
Regaining stability above this key level will help in the alt bid to retest $0.55. We may also see this resistance flip, depending on the buying pressure. While ripple gears up for massive uptrends, Huobi Token is on a streak.
Huobi Token Sees Third Consecutive Day of Massive Surges
HT is a huge contender for the top gainer this week. The token recorded massive increases on Monday as gained stability above $5 for the first time since August. It opened trading at $4.1 but closed at $5.4, signifying a more than 24% positive change in price.
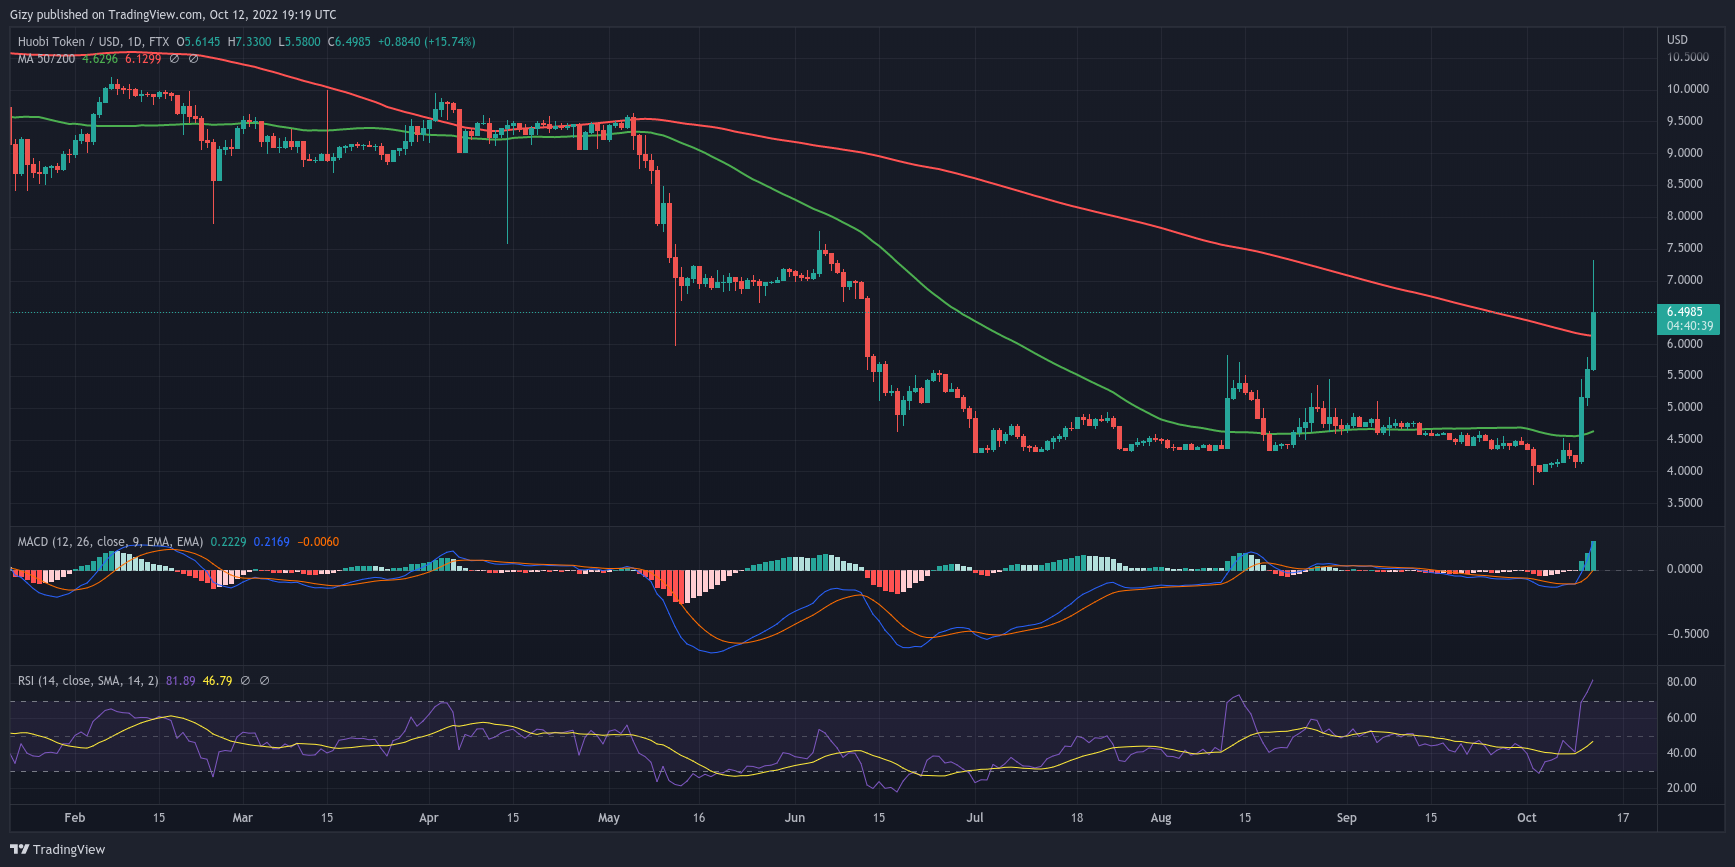
The bulls built on this foundation on Tuesday as we observed another green candle. This time, it faced strong resistance at $5.8 but ended the session with a price change of 8%. The current intraday session offers more price increases than the previous one.
HT surged above $7 but met strong resistance at $7.3. As of the time of writing, the asset is worth $6.5. This is still a huge change from its opening price at $5.6. However, several indicators are blaring warnings.
One such is RSI. The metric is at 80, indicating that huobi token is overbought. The rules governing this indicator clarify that an overbought asset is due for a correction. The next 24 hours may be bearish to bullish with reduced trading volume.
In either scenario, HT will experience massive retracements before the end of the week. One key level to watch is the $5 support.