


Most assets like BTC are seeing notable increases over the last seven days. These assets are reclaiming levels they lost during the previous bearish run. In addition to these increases, the global cryptocurrency market cap is on the rise.
The sector opened the week at $843 billion but dipped to a low of $814 billion. It recovered and surged to a high of $866 billion. At the time of writing, the market is worth more than $858 billion.
Although the margin of difference is not massive, it showed that the crypto market is gradually recovering from the previous huge dip it experienced a few days back. Nonetheless, the image below shows the level of increase most cryptocurrencies had.
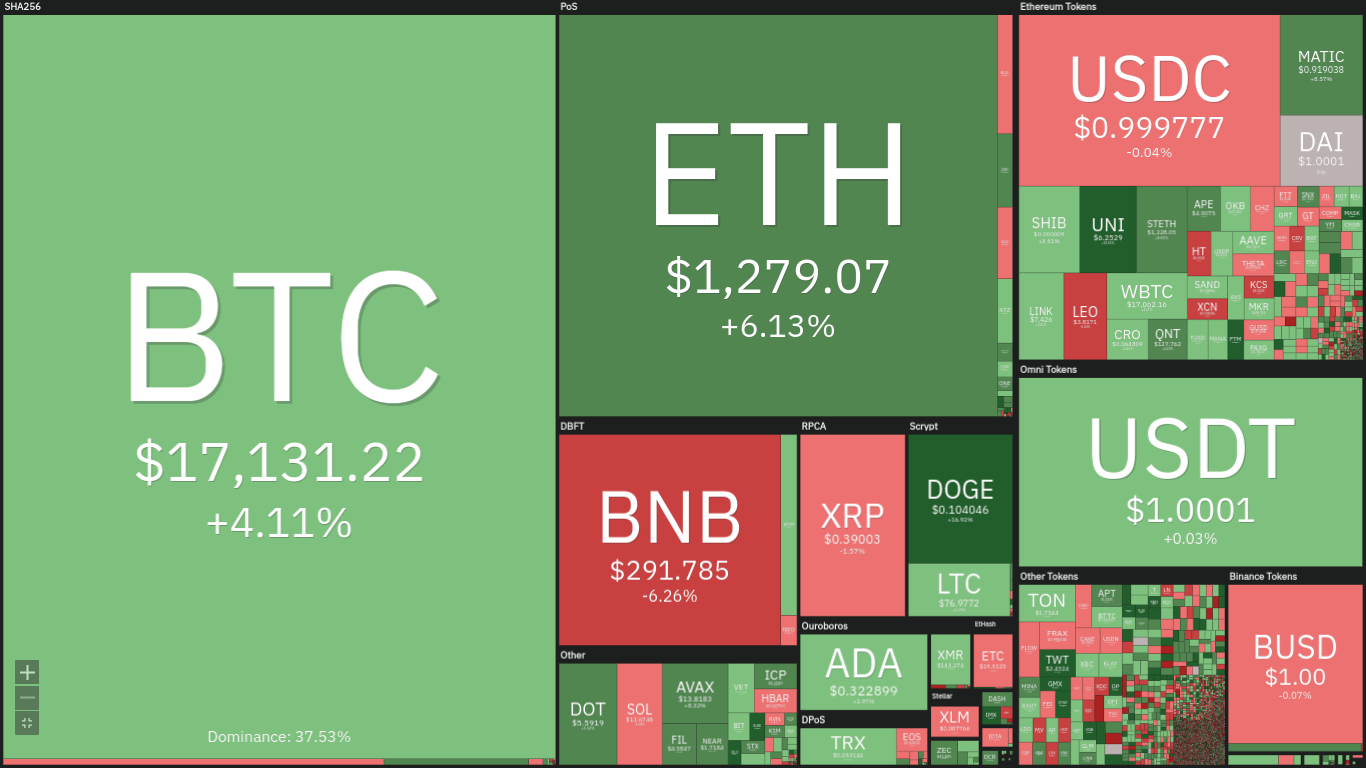
From this figure, we noticed that the past week was filled with different sentiments. A clear indication of this is the array of both the greens and the reds. According to Cryptocurrenciestowatch, the top gainer over the last seven days is FTM.
The asset enjoyed massive increases that saw it end the previous intraweek session with gains of more than 30%. The second runner-up is a fairly new coin to the top 100. GMX closed with gains of more than 20%.
On the other hand, the top loser was XCN as it lost more than 27%. When such massive increases and decreases take place, most turn to the fundamentals. However, there is no big news that could affect price performance. Let’s see how some coins in the top 10 performed.
BTC/USD
Bitcoin had one of its best performances of the previous month. During what many would consider a final attempt at reclaiming lost levels, it surged above $17k. Let’s break down price action during this time.

What we are seeing is similar to what transpired two weeks ago. It started the week slow as it failed to record any significant increase or decrease on Monday. Following a bad start, one outlook predicted that the apex coin will retest $17k.
It also noted that the last three days of the intraweek session may be filled with little volatility. Tuesday saw a build-up to this prediction as it held on to the $16k support. It finally broke the highlighted mark the next day.
The coin had its first table change in price as it peaked at $17,223 and closed with gains of more than 4%. As predicted, price action over the last four days had little or no impact on BTC. One reason for this is the coin inability to break out of its trend.
On average, the asset lost or gained less than 2% as it constantly surfed between $16,800 and $17k. On the weekly scale, there are good news. For the first time in over four weeks, the largest cryptocurrency by market cap registered notable increases.
As a result, several are looking bullish. Two weeks ago, fears of a bearish convergence on the 1-week chart was high. However, the notable increase allayed these concerns. The same sentiment surrounded the Relative Strength Index as the metric gained more leverage above 30.
We also noticed the same thing on the daily chart. On Monday, the 12-day EMA was slightly arched and was in the process of a bearish convergence. The first green on Tuesday made the downtrend halt. RSI also peaked at 49 from 37 which indicates a significant increase in buying pressure.
ETH/USD
Ethereum had the same movement as BTC. It had a bad start to the week as it failed to impress. The situation had many wondering how prices will play out. One analysis stated that the cryptocurrency may experience the same sentiment as two weeks ago.
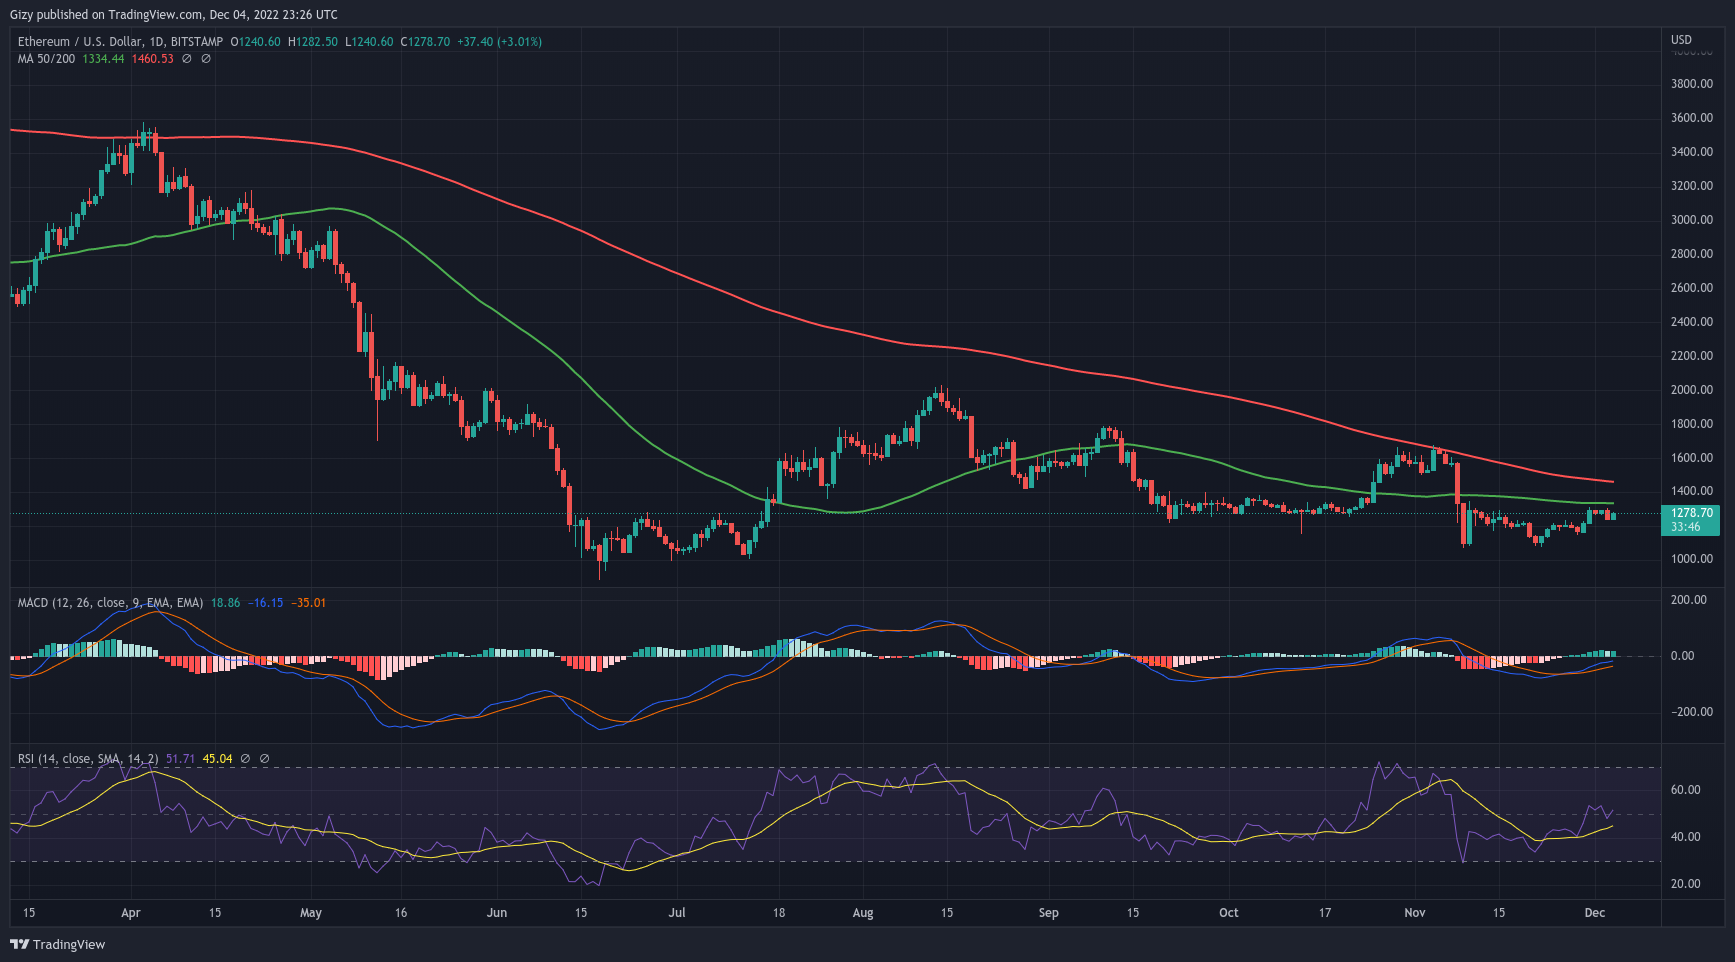
The trend was that the asset will see most of its increase on Tuesday and Wednesday. Afterwards, it will lose momentum and trade sideways for the rest of the session. Price played out exactly ths way.
First, the coin erased the losses it incurred on Monday as it saw its first green of the week. The biggest move to the top happened on Wednesday when the largest altcoin surged from $1,215 to peak at $1,310.
It closed a little lower, but this marked a more than 6% change in price. Following this massive positive change, many look forward to more uptrends. However, as predicted, the last four days of the previous intraweek session, with the exception of Saturday and Sunday, were marked with reduced trading volume.
During the last two days, more drama unfolded as the bears caused a downtrend that saw ETH lose more than 4%. It recovered the next day but failed to erase all the losses. Nonetheless, this had very little impact on the weekly performance.
On this scale, the altcoin had its biggest increase over the last four weeks. It closed the previous intrawwek session with gains exceeding 7%. Like BTC, the 12-day EMA continues its surge, which means that previous fears of a bearish divergence on the weekly is almost zero.
The same sentiment is what we see on the daily chart. RSI also peaked at 53 as the bullish dominance reached its highest.
BNB/USD
Binance coin failed to meet the expectations of most traders. Following a splendid performance two weeks ago, many expected the uptrend to continue. However, a weekly outlook pointed to a massive downtrend.
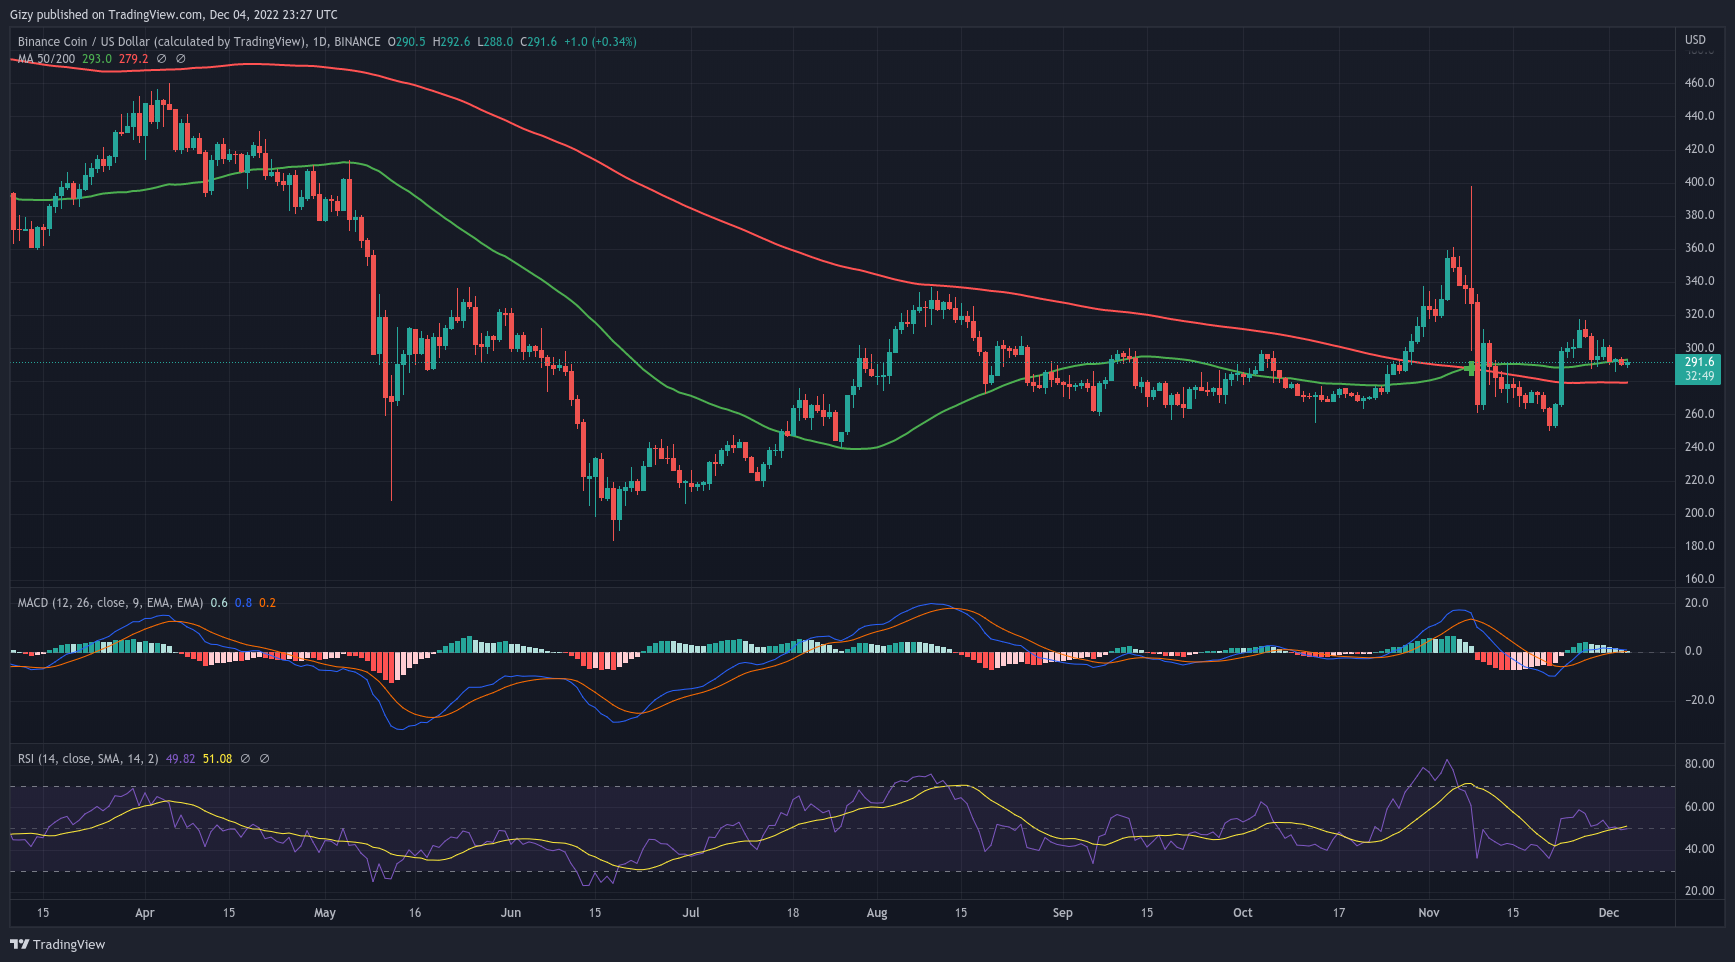
Using the Relative Strength Index, the write-up acknowledges the notable decrease in buying pressure which may result in a massive downtrend for the asset. This is exactly what happened during the previous intraweek session.
It started the week a bit slow. On Monday, it dipped from $307 to a low of $287. It recovered and closed with losses of more than 4%. Following this drop, many feared more downtrends.
BNB failed to record any notable changes in price over the next two days. It dipped further on Thursday and closed with losses of almost 3%. The last three days of the week were marked with reduced volatility that had little or no impact on price
On the weekly, the asset lost more than 5% of its value. The gradual drop in price had a massive impact on the trajectory of some indicators. The first is the Moving Average Convergence Divergence.
After Monday’s trading action, the 12-day EMA started its downtrend. As a result, the metric was in a bearish convergence. Although the full interception did not take place during the previous week, there are indications of more downtrends in coming.
The Relative Strength Index is another indicator that had a change in trajection. The metric dipped from 57 to a close at $49. It is also important to bear in mind that it held on to some vital supports.
One such level is the $280 support. It dipped to a low of $285 and rebounded due to notable demand concentration at the mark. Nonetheless, it peaked at $309.
XRP/USD
The past week is one many traders would love to forget for more reasons than one. It had a bad start and recorded little. On the first day of the intraweek session, the altcoin had its biggest drop.
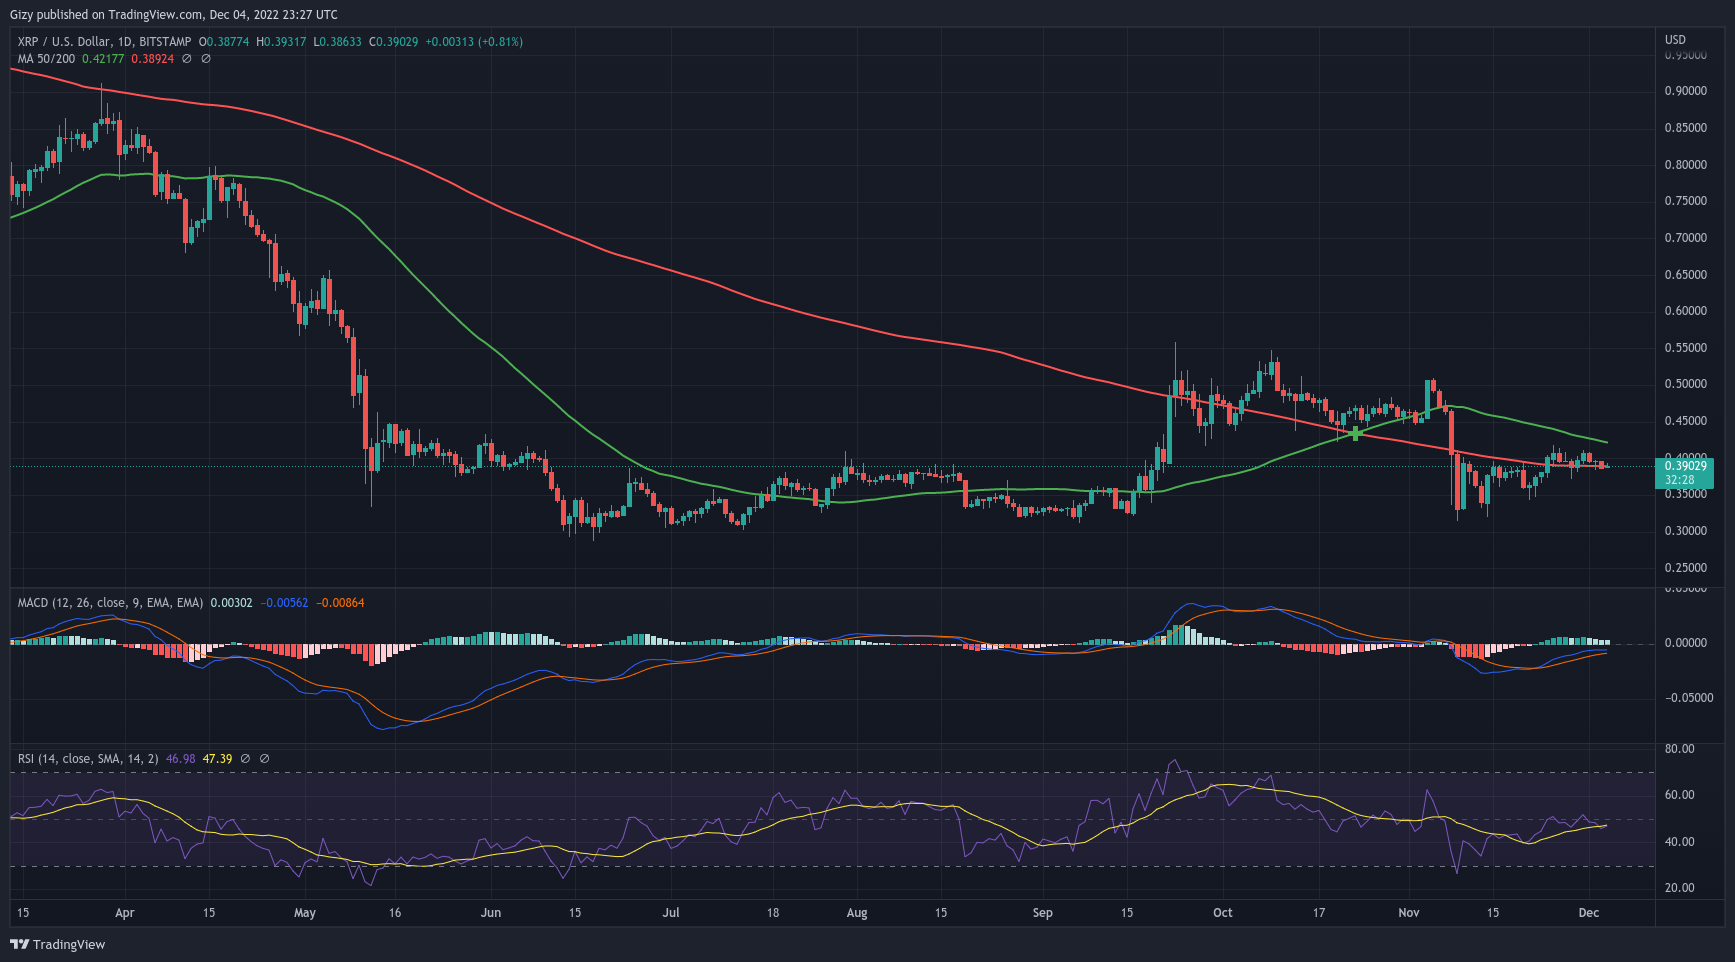
It opened trading at $0.39 and failed to record any increase as it experienced massive selling pressure. As a result, it dipped to a low of $0.37 but recovered before the day came to an end. However, it closed at $0.38 which signifies no notable change in value.
Over the next two days, the bulls staged a comeback. On Tuesday, the asset tried reclaiming the $0.40 resistance and recorded notable success. Nonetheless, it ended the intraday session with gains of almost 3%.
It successfully broke the $0.40 resistance as it peaked at $0.41. In the end, it closed Wednesday with gains of almost 3%. However, it lost the accumulated gains on Thursday. Another notable decrease happened on Saturday.
On the weekly scale, there were no massive changes in value. The coin’s failure to record any notable increase is speeding up the a bearish convergence on the daily chart. RSI also depicts the decrease as it ended the week at 47.