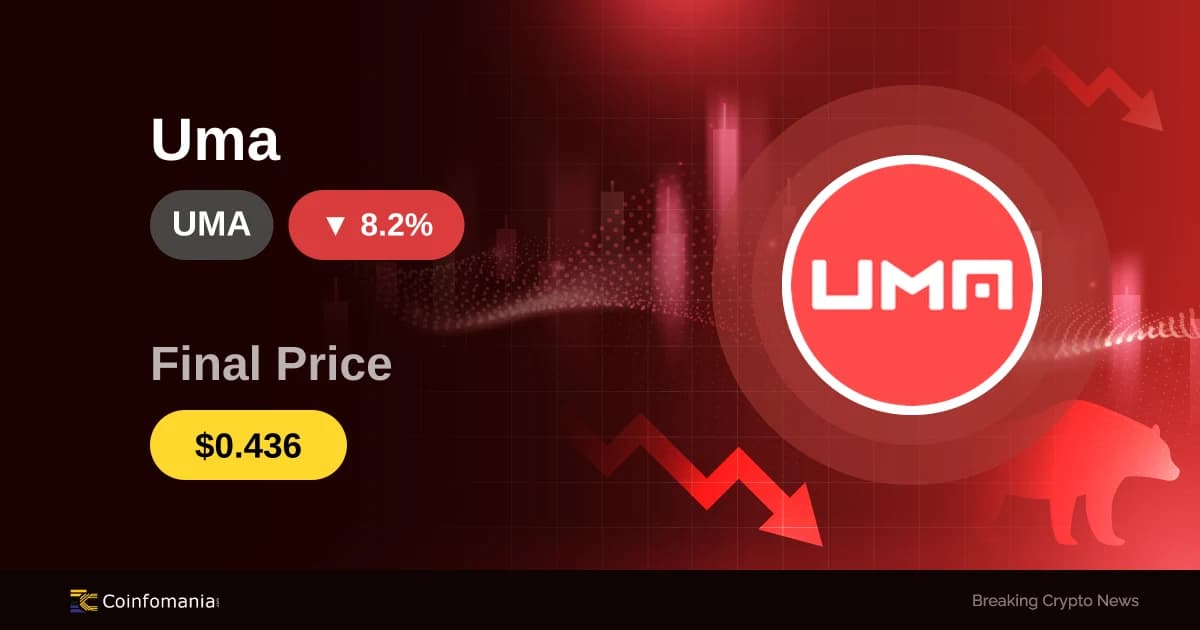
Market Shock — UMA Tumbles 10.86% in Just 60 Minutes
UMA price tumbles 10.86% in one hour. Explore the market dynamics and trading activity behind this shift.
Quick Take
Summary is AI generated, newsroom reviewed.
UMA price drops 10.86% in just 60 minutes amidst market volatility.
Trading volume surged as traders reacted to the sudden price movement.
Market observers note mixed signals in the broader crypto landscape.
Trading volumes for UMA surged significantly as the price plunged 10.86% in just 60 minutes. Currently, the UMA price stands at $0.427, reflecting a notable shift in market sentiment. This rapid decline has raised eyebrows among traders, prompting discussions about potential underlying factors.
Market Snapshot
The token is currently trading at $0.427 after touching a 24-hour high of $0.482 and a low of $0.401. Daily trading volume has reached $1,840,427.19, reflecting heightened market participation. The asset now holds a market capitalization of $39,514,480, showcasing its position in the crypto landscape despite recent volatility.
What Could Be Behind This Move
Market observers note that recent fluctuations in UMA’s price could be attributed to broader market trends. The crypto space has shown mixed signals, particularly with leading assets like Bitcoin and Ethereum experiencing volatility. This environment often leads traders to react quickly to price movements, causing heightened activity around altcoins such as UMA.
Trading Activity
Additionally, on-chain data indicates an increase in trading activity, with many traders likely capitalizing on the price decline for short-term gains. The recent drop from $0.479 to $0.427 suggests a sell-off, possibly influenced by fear of further declines or profit-taking after earlier gains. The increase in volume during this period implies that traders are actively engaging with UMA, reflecting a heightened sense of urgency in the market.
On-Chain Signals
Furthermore, the network’s on-chain transactions have also pointed towards a surge in activity, with more addresses participating in the trading process. This increase in active addresses may suggest that traders are attempting to navigate the current volatility by moving their holdings. Analysts suggest that such movements can create a cascading effect, leading to further price adjustments as market participants react to each other’s actions.
What Traders Are Watching Next
Looking ahead, traders are closely watching key price levels for UMA. The next resistance sits at around $0.450, while support is seen near the recent low of $0.401. A break above the resistance could signal a potential recovery, while a drop below support might amplify bearish sentiment. Additionally, broader market conditions will play a crucial role in shaping UMA’s direction as participants remain vigilant for any significant catalysts or trends that may influence price movement.
This article is for informational purposes only and does not constitute financial advice. Readers should conduct their own research and consult a financial advisor before making investment decisions.
Follow us on Google News
Get the latest crypto insights and updates.