LTC Price Analysis of March 11, 2025: Litecoin Attempts to Break Above $90, Will It Happen Today?
Let’s take a look at the LTC price analysis of March 11, 2025, to understand Litecoin’s market trends and investment potential in 2025.

Have you been tracking the LTC price today and wondering what lies ahead? Then, welcome onboard as we take a detailed look at LTC price trends over the past 24 hours and try to make sense of what’s to come. Let’s study the LTC price analysis, identify trends and patterns, and check LTC price predictions about what’s to come.
LTC Price Analysis of the Last 24 Hours
Litecoin started the day with a consecutive death cross and golden cross pattern, causing the price to go down and recover quickly, standing at $96.31 at 01:00 UTC. While two more death crosses formed on the MACD line, the overall trend remained slightly upward. A bullish triangle seemed to be forming, hinting at further upward movement. The price entered a trading range at $96.21 at 04:30 AM UTC.
An hour later, a death cross marked further descent, controlled, however. The price saw a negative breakout out of the trading range, reaching $94.85 by 09:10 in the morning. At that point, the MACD line showed a golden cross, a significant one at that, as the price spiked upward and reached $99.12 by 09:20 UTC, establishing its 24H high.
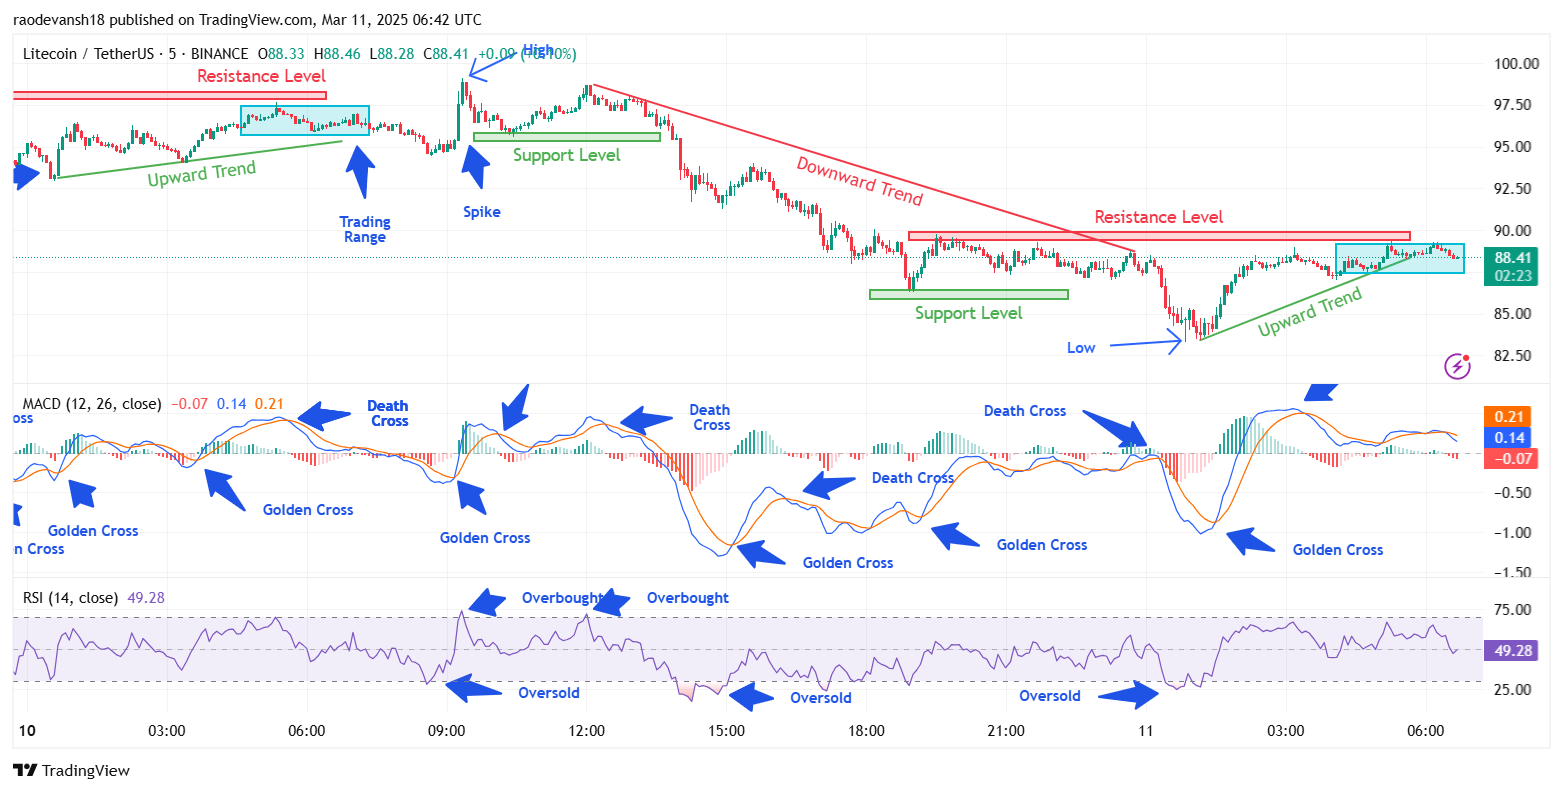
Chart 1, analyzed by raodevansh18, published on TradingView, March 11, 2025
However, LTC’s fluctuation at $100 resistance continued, and it could not sustain the climb. The RSI reached overbought levels, and selling pressure increased as the price was again brought down to the support level at $95.9 at 10:25. With the MACD and RSI looking conducive for another uppish trend, the price again ventured close to $99 but failed to capitalize as an extended downtrend began.
The trend began with a sudden plunge, with LTC going from $96 to $92.3, shattering the key support level. The downturn eventually led LTC to find support at $87.74 at 19:00. Supported by a golden cross, the price attempted an ascent, getting rejected by a $89.8 resistance. The price fluctuated between the new resistance and $87.10, ending the day at $87.55.
LTC Price Prediction for March 11: What Indicators Suggest
March 11 started with a dip for LTC, as it went from $88.15 to $83.67 at 01:10 UTC, characterized by a death cross at 00:15 and the RSI reporting oversold levels. At 01:30, a golden cross appeared as LTC again started ascending, finding strong resistance at $89.19. A trading range was seen in the works in the early hours of March 11, as the upward trend seemed to be persevering.
A bullish triangle could be seen, with a horizontal resistance and the support levels touching consecutive higher lows, hinting at a possible resistance break. The last update for the day saw a trading range being formed, with perhaps a potential breakout around the corner.
Will LTC Break Resistance or Drop Further? : LTC Price Analysis
In the last 24 hours, LTC has witnessed a gradual uptrend, followed by a downtrend that took the price deeper into the $ 90 range. While the coin continues to have small upward spikes, the overall trend is bearish. As of now, bullish claims of LTC price today reaching $100 seem implausible. Based on previous performance, another downtrend should be looming, characterized by small highs during the day.
Follow us on Google News
Get the latest crypto insights and updates.