


KAVA received a lot of attention this month. As a result, the coin is cruising to the end of its best-performing month.
A look at the monthly chart reveals the asset saw a lot of action. May is currently the longest candle on the chart. The weekly chart paints a clearer picture of some key events that took place. Let’s look at them
KAVA 38% in Week 2
It is no news that the first week of may was bearish for the entire crypto market. The altcoin under consideration also suffered from this sentiment. As a result, it lost more than 6%. During this intraweek session, the asset lost a long-term support; the $0.75 barrier. It dipped as low as $0.71 before a slight rebound.
It dipped further in week 2 as it broke the $0.70 support and hit a low of $0.67 before a massive price rally. Once the surge started, it broke several resistances. The first was the $1 barrier that held out for more than six weeks.
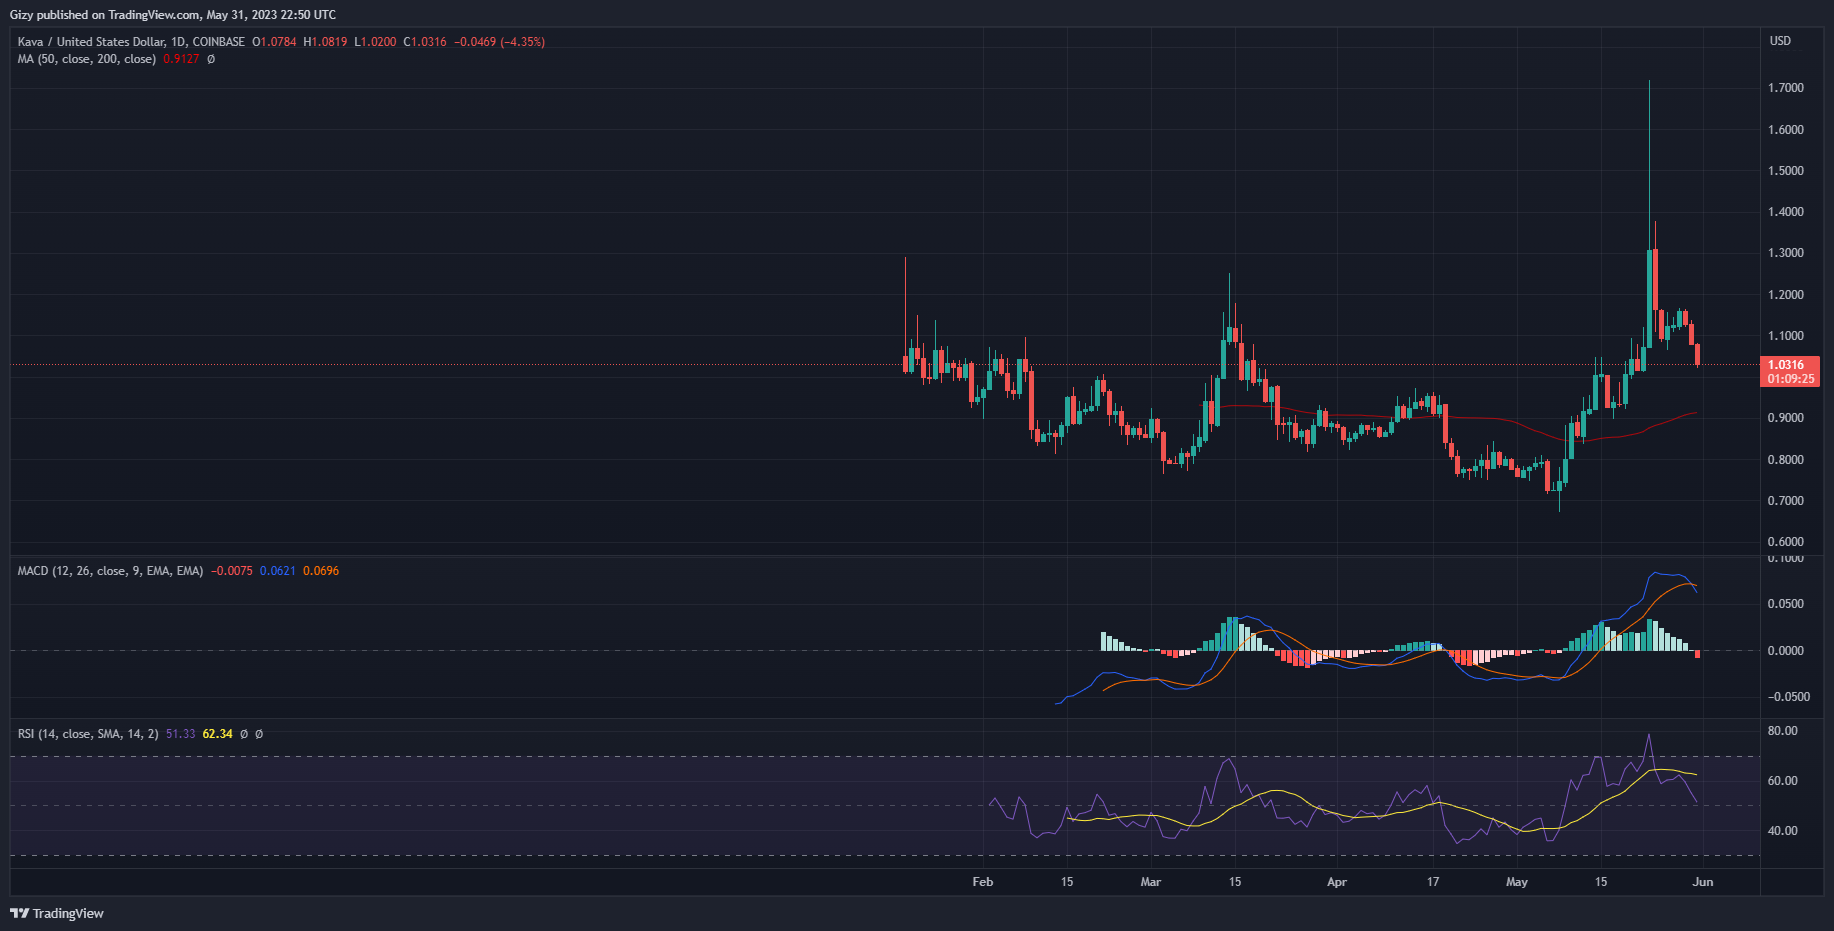
On the daily chart, we noticed in the process of retesting this critical level, KAVA had hiccups at $0.90. After failing to flip it on the first trial on May 9, we noticed it retraced to the $0.80 support. It saw a massive demand concentration at this mark that saw it flip the said mark the next day.
After flipping $1, it went on May 23 when it gained more than 21%. It kicked off trading at $1 and surged to a high of $1.71 before retracing to a close at $1.30. However, this marked the last major push at resistance during the period under consideration.
It is also worth noting that the altcoin was overbought during this period, hence, the correction.
Currently exchanging a little above $1, KAVA is set to end the fifth month of the year with gains of more than 33%. However, there are strong indications of an impending downtrend that may see the asset dip further. How low will it go?