


Bitcoin price went berserk a few days ago. Over a period of twenty days, the apex coin failed to break out of the $26.5k-$28.8k channel.
This changed when the asset flipped $29k and gained stability above it—this built anticipation of a retest of the $30k resistance on Tuesday. We noticed several reactions from traders and indicators on the chart.
The first metric of interest was the Moving Average Convergence Divergence. The 12-day EMA and the 26-day EMA were largely bearish over the last thirty days. The previous bearish divergence reversed as a result of the most recent bullish trend. We are observing a bullish divergence at the time of writing.
We also noticed notable increase in buying volume. We clearly see this on the Relative Strength Index as it peaked above 70 and is currently close to the mark.
Aside from these readings on the charts, BTC received a lot of reactions from the trading communities. While some were filled with fear and uncertainty, others were positive.
One such was the declaration that the bear market was over. A popular user on Twitter added an accompanying image from Glassnode, depicting unrealized profit/losses.
Is the prediction right? Let’s examine the image.
Glassnoode Chart
The image below is easy to understand as we noticed several labels. However, the patterns and the outcome are of utmost importance.
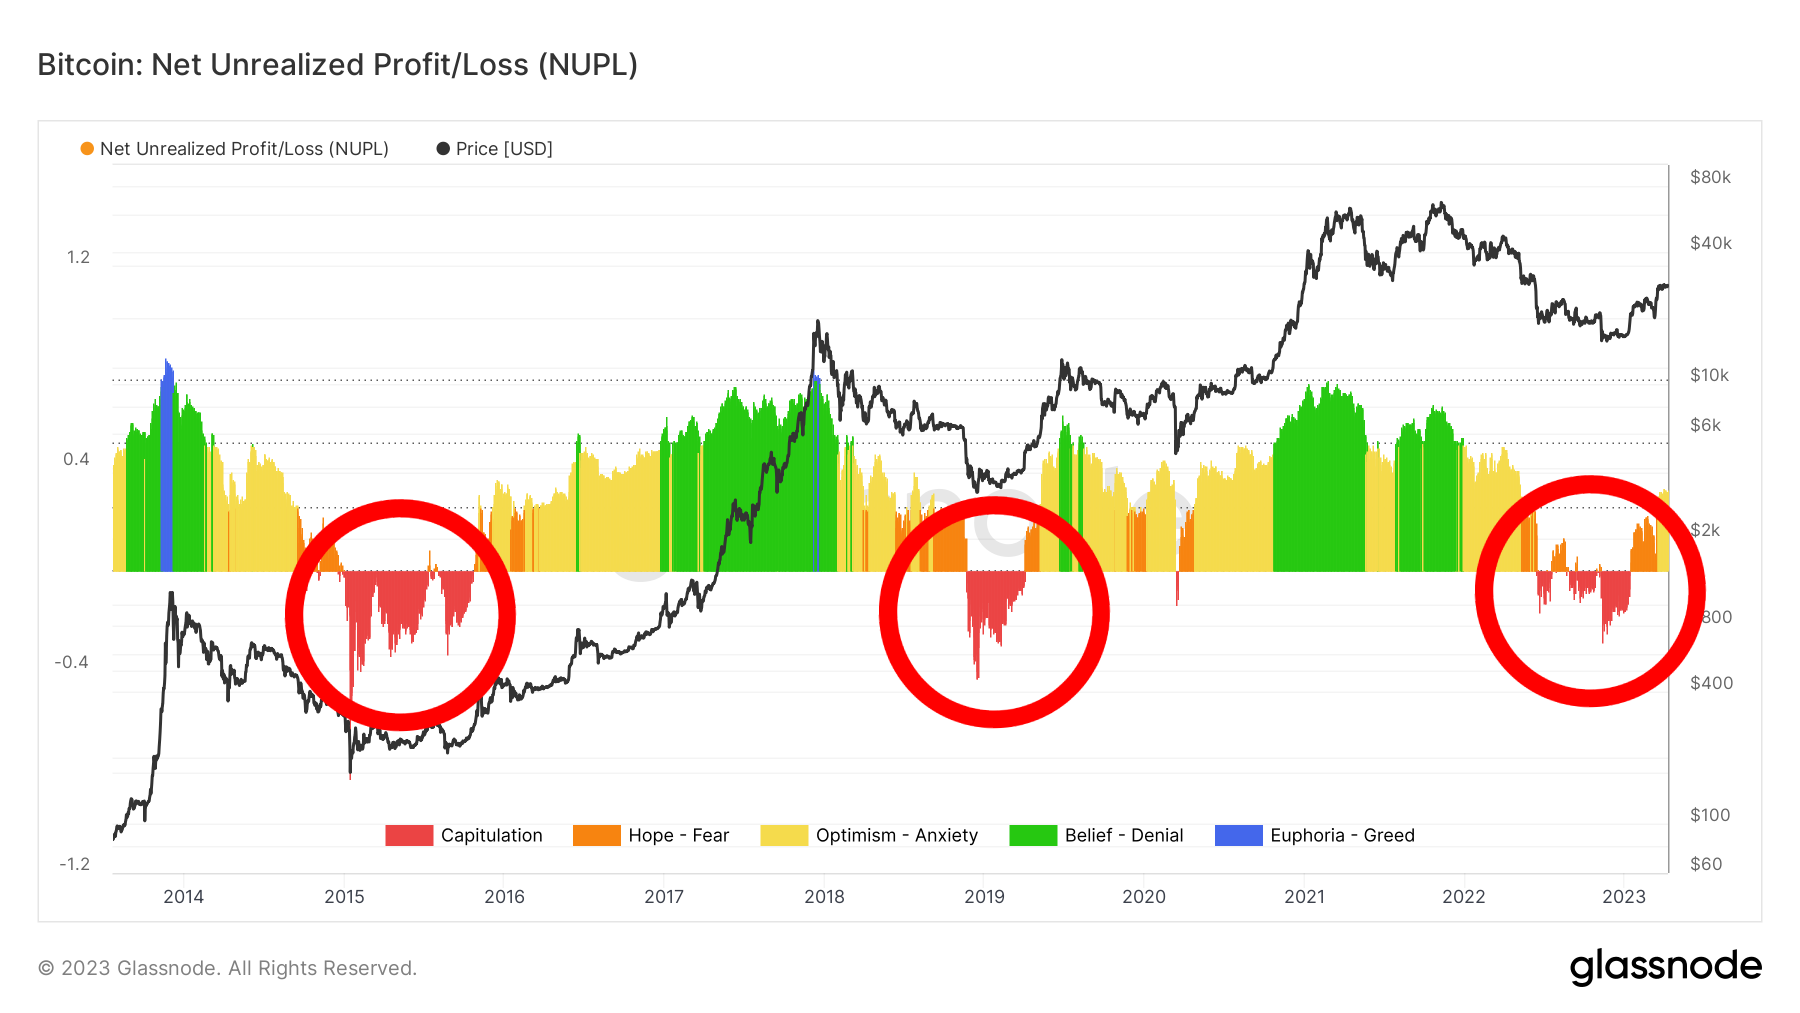
According to the chart, after a massive capitulation, the next trend is a long period of significant price improvement. This happened on two different occasions with the same result.
The first was between 2015 and 2016. Following the bearish actions, BTC recovered from a low of $400 and surged above $10k in 2018. This was also the start of another bear market that resulted in the second major capitulation in 2019.
Following that year’s event, another massive bullish period lasted almost three years.
The same pattern is also present at the time of writing. Following the previous trends, we may conclude that the current bear market is gradually coming to an end or ended. However, let’s see what the long-term chart says about this.
Bitcoin May Test $34k
It is worth noting that some metrics are bearish at this time. The first to consider is the fear and greed index.
Currently at 61 which depicts fairly healthy sentiment across the market, it is farther than it was three days ago. At that time, it peaked at 68. This is an indication of FUD gradually returning to the market. We expect a notable decrease in buying volume in the coming days.
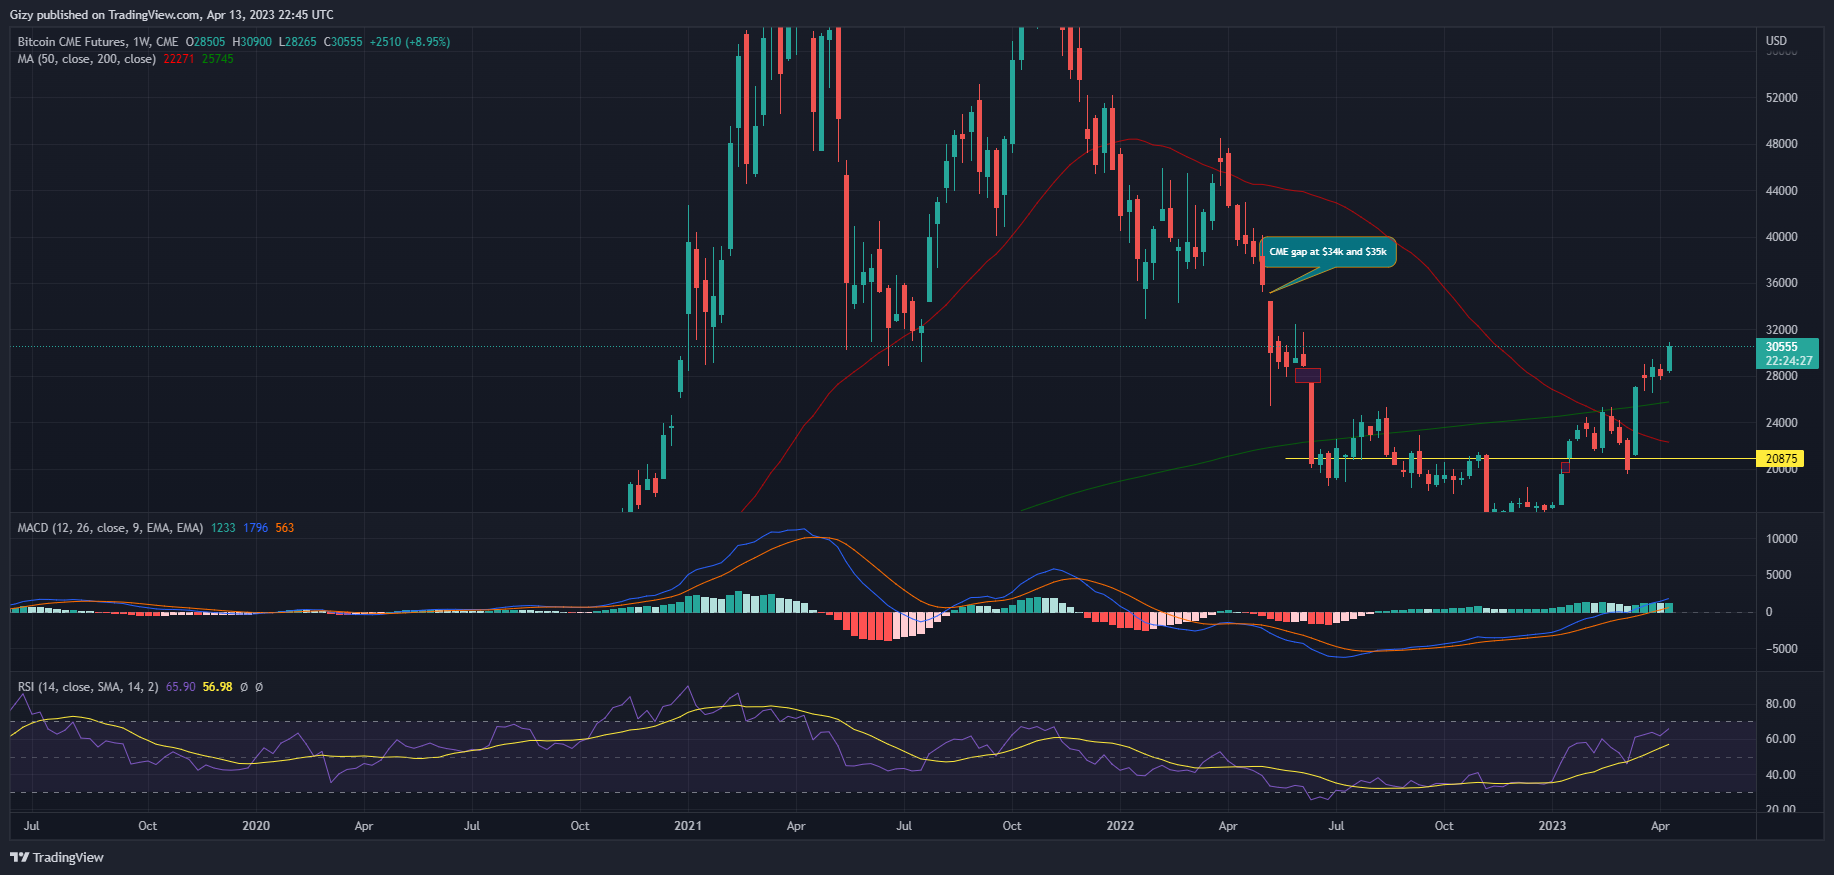
On the other hand, the CME displays a more positive outlook for the asset. We noticed a small CME-gap between $34k and $35k. This may be an indication of where the bullish train may stop next.