GALA Falls from $0.024 to $0.0197 – Is This the Last Pullback Before a Reversal or More Downside Ahead?
Will you be investing in GALA? If so, you may want to know if the market is currently friendly enough. The GALA price chart analysis shows that the last week has been highly volatile, with the price testing various support and resistance levels

Will you be investing in GALA? If so, you may want to know if the market is currently friendly enough. The GALA price chart analysis shows that the last week has been highly volatile, with the price testing various support and resistance levels. Recent price activity shows that the market is struggling to establish a definitive trend, with regular bullish breakouts and bearish pullbacks.
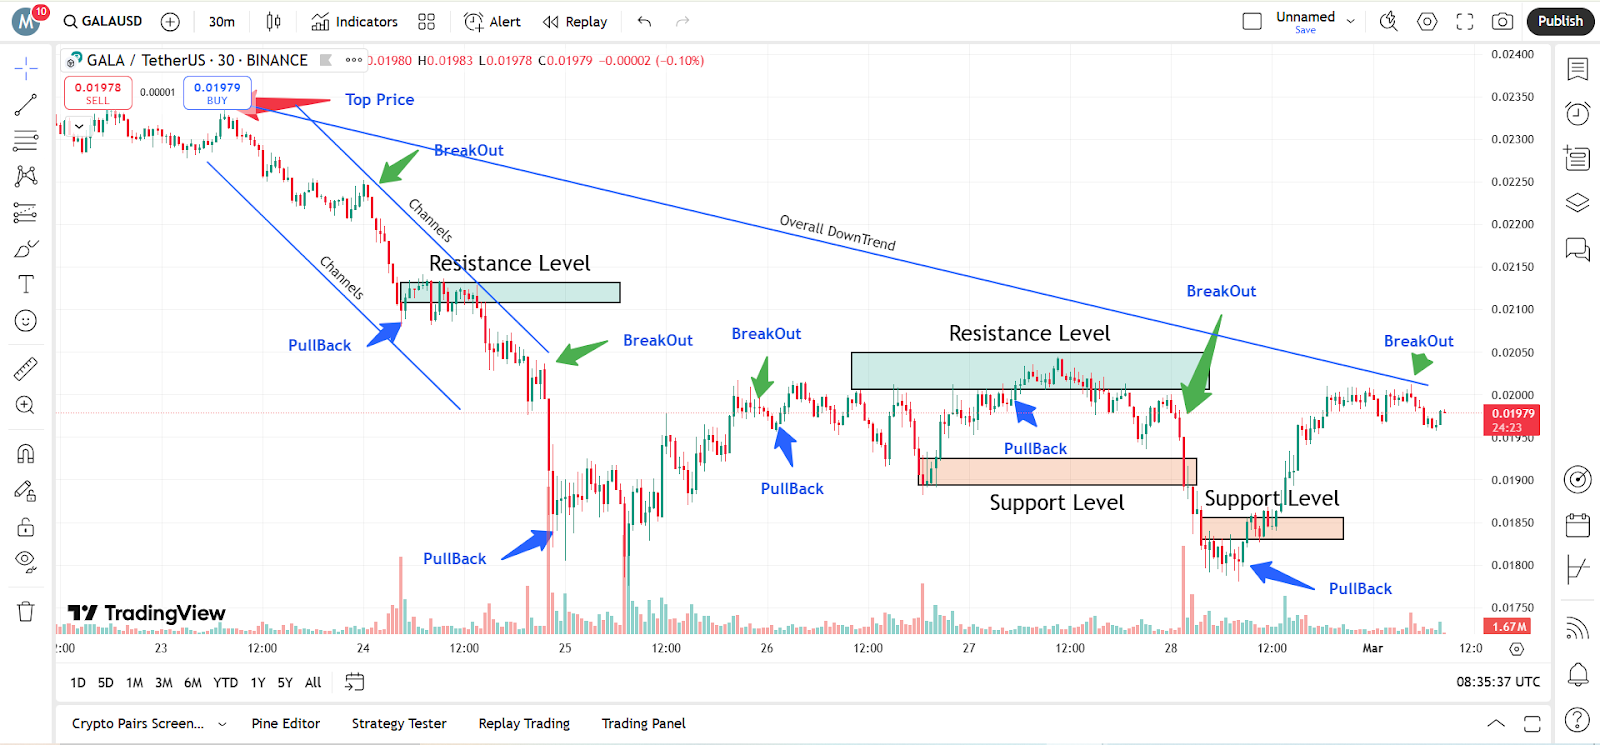
As it hit an all-time high of $0.024, GALA came under intense selling pressure, which sent it into a downtrend channel. A few breakout attempts were witnessed but could not be sustained, resulting in repeated pullbacks. Nonetheless, the recent GALA price analysis suggests that there might be a trend reversal, with buyers trying to drive the price upwards.
Analyzed by Meghana published on TradingView on March 1
GALA Price Analysis: Weekly Overview (23rd Feb – 28th Feb 2025)
On 23rd February at 10:00 UTC, GALA began the week with a solid uptrend, touching $0.024. But the selling pressure accelerated, and it declined sharply. On 24th February at 13:00 UTC, the price dipped to $0.021, hitting a critical resistance level that it could not overcome. According to GALA price analysis, the downtrend prevailed, and the price dropped to $0.0195 on 25th February at 09:45 UTC. There were several pullbacks, but they were not aggressive enough to cross the downward channel. The GALA recent price movement indicated a bearish formation with lower highs and lower lows during the week.
On February 26th at 12:30 UTC, GALA tried to recover, momentarily crossing above $0.020, but resistance pushed the price downwards. The GALA price analysis indicated that the buyers were fighting to take control, resulting in another drop toward $0.019.
By 27th February at 07:00 UTC, there was another attempt at a breakout by GALA, reaching up to $0.021 but again being rejected at the level of resistance. This led to a steep withdrawal, lowering the price to $0.0185. The recent GALA price fluctuations showed the relentless struggle between bears and bulls, but neither was gaining command. On 28th February, T 06:30 UTC, GALA experienced a dramatic turnaround from $0.0175 to $0.0198. The GALA price analysis indicated that the buyers were gaining strength and, if sustained, breaking above $0.0205 would seal a trend reversal.
GALA Recent Price and Market Trends (1st March 2025)
On 1st March at 03:00 UTC, GALA traded at about $0.0197, trying to pierce significant resistance levels. By 08:30 UTC, GALA tried to break above $0.020, but sellers were still in action. The price action of GALA showed that the market was still not decisive and that there was no confirmation of the breakout yet.
By 12:40 UTC, GALA had reached the $0.0205 resistance level, a key level for establishing a bullish trend. If GALA holds above this level, it could go up to $0.021-$0.022.. However, not breaking this resistance might lead to another $0.0185-$0.019 pullback. The RSI is approximately 45-55, which is showing neutral to mildly bullish momentum, and the MACD is close to the zero line, with a possible bullish crossover if the price sustains above $0.0205.
GALA’s recent price movements suggest that buyers are active, but resistance remains strong. The price action is forming a range-bound pattern, indicating that a significant breakout could be imminent. The GALA price analysis suggests that if bullish momentum increases, GALA could target higher resistance levels in the coming days.
Final Thoughts
GALA’s recent price movement has been highly volatile, with repeated attempts at breakouts and pullbacks. The price analysis shows that the market is at a juncture, and traders must look at the primary resistance and support levels for trading opportunities.
A successful break above $0.0205-$0.021 would affirm bullish strength, while the inability to hold above $0.019 could portend another pullback. Until confirmation, the GALA recent price action indicates that a significant move is imminent.
Traders must stay alert and wait for crucial breakout levels before entering significant trading. According to GALA’s price analysis, a substantial price movement is coming, but its direction will depend on the upcoming attempt at breaking out.
Follow us on Google News
Get the latest crypto insights and updates.