Ethereum Price Analysis of March 5, 2025: ETH Reaches $2220 after Recovering From $2000 Dip
Let's take a look at the Ethereum Price analysis of March 5, 2025, as it fluctuates between key levels and explore its future scenario.
Author by
News Room

If you are tracking Ethereum and curious about Ethereum price analysis, then this analysis is for you. As we go through the analysis, we will determine the key support and resistance levels of Ethereum and how it may behave in upcoming trading sessions. The Ethereum price today appears to be in a trading range as Ethereum fluctuates between its critical levels. Without any further delay, let’s dive into the Ethereum price analysis and see how the Ethereum price today might behave.
Ethereum Price Analysis for the Last 24 Hours
At 01:35 UTC, the price broke to the downside of a downward-moving channel, showing the conviction of the sellers. At the same time, the RSI dropped below the level of 30, indicating an oversold market condition. At 02:35 UTC, MACD showed a golden crossover that pushed the market to the upside.
Ethereum formed an upward-moving channel that broke out to the downside at 06:40 UTC, further corroborated by the death cross of MACD at the same time. The market formed an expanding triangle pattern that broke out to the downside and formed a range there. The range broke out to the upside, but the breakout candle proved to be just a gap to the buy-side, and the breakout failed.
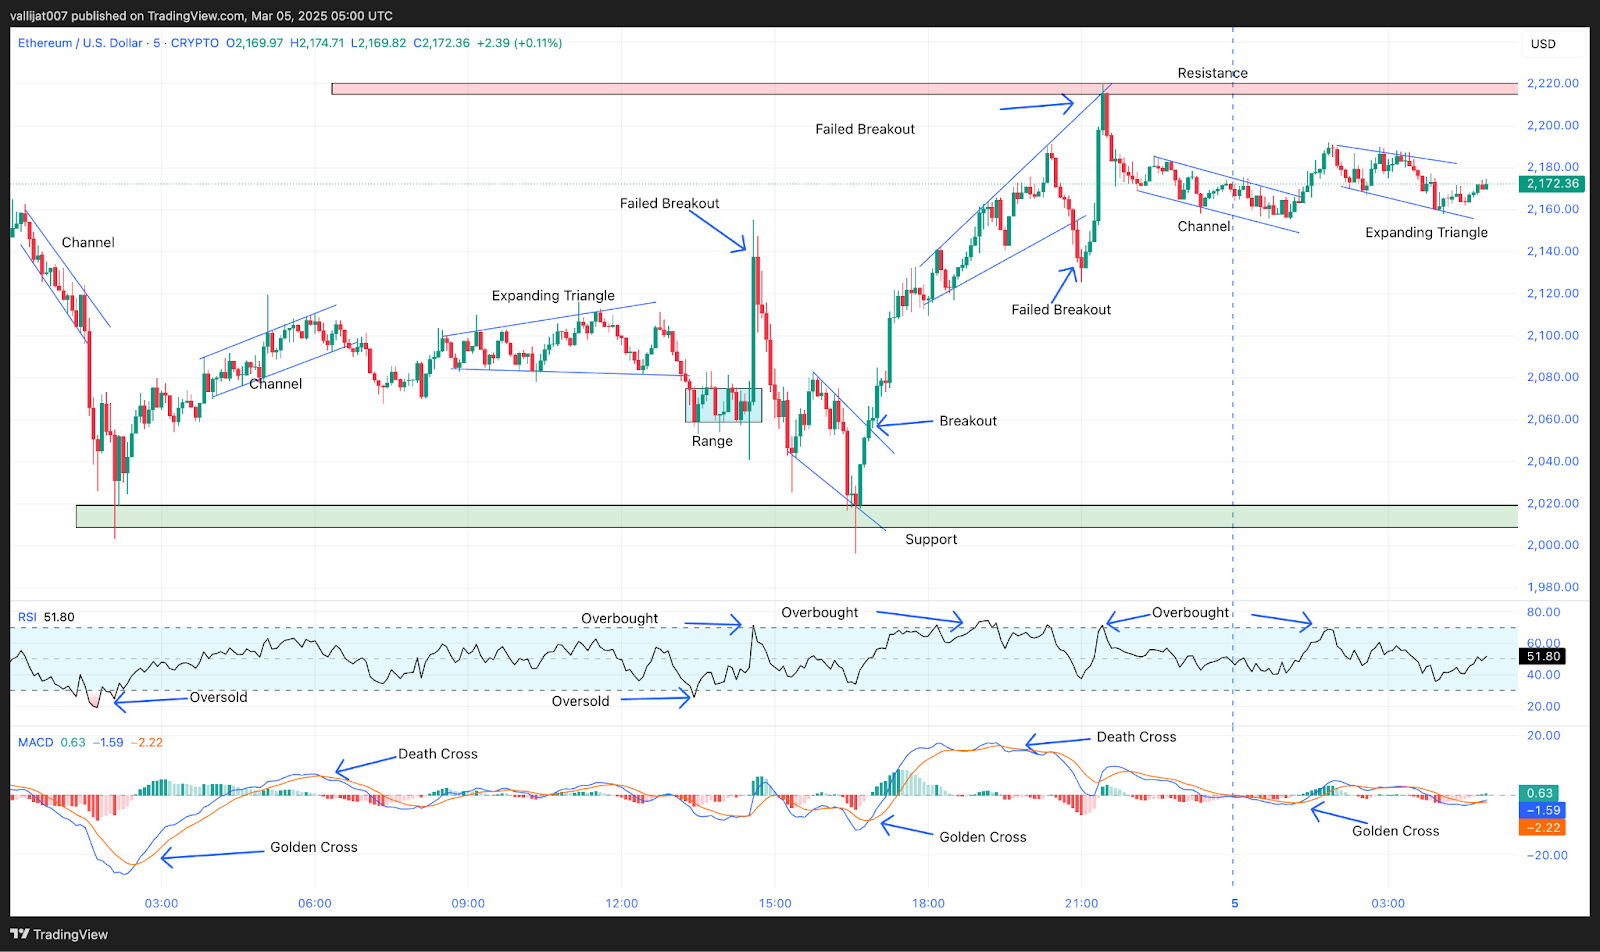
Chart 1: Analysed by vallijat007, published on TradingView, March 5, 2025
Ethereum formed a support level at $2000, and when the price reached that level in a channel, the channel broke out to the upside at 16:50 UTC, further corroborated by the golden crossover of MACD. The breakout formed a spike and channel pattern. At 19:00 UTC, RSI moved into the overbought area, indicating an overstretched market price and suggesting at least a pullback in the price. The price pulled back in the form of an expanding triangle.
Key Resistance and Breakout Patterns
At 20:50 UTC, the expanding triangle broke out to the downside but failed to form a spike and reversed back into the expanding triangle. The price marked the high for the day at $2220 at 21:25 UTC. At the same time, RSI moved to the oversold area, and the price pulled back from that area, creating a resistance zone at $2220.
Ethereum created a channel that broke out to the upside at 01:20 UTC on 5th March, further corroborated by a golden cross of MACD at the same time, but the spike was soon followed by an expanding triangle pattern.
Ethereum’s Range-Bound Movement: Key Levels to Watch
As the price of Ethereum fluctuates, to clearly see any trend, Ethereum has to break its critical levels. Most of the time, the price remains in a trading range, and by showing the volatility for the past few days, Ethereum might rest for some time, meaning it may trade in a range-bound market before any further directional movement. Traders and investors should be cautious and avoid taking breakout positions, as most breakouts in a range-bound market fail to form a trend.

News Room
Editor
Newsroom is the editorial team of CoinfoMania, delivering 24/7 crypto news, market insights, and in-depth analysis. With 30+ journalists worldwide, we keep you ahead in the blockchain space.
Read more about News RoomRelated Posts

Ripple News: Hidden Road Deal Sets XRP Up to Kill SWIFT — Are You Ready?
News Room
Editor

Solana’s $150 Potential: How Today’s Revenue Trends Are Setting SOL Up for Massive Gains?
News Room
Editor

Ripple’s FINRA Breakthrough Could Skyrocket XRP Price – CEO Brad Garlinghouse Weighs In
News Room
Editor
Loading more news...