


Key Highlights
- Ethereum (ETH) fell to the support above $130
- The coin may reach a low of $122 if the selling pressure persists
Ethereum (ETH) Current Statistics
- The current price: $139
- Market Capitalization: $15,190,776,668
- Trading Volume: $8,530,188,863
- Major Resistance Zones: $175, $200, $225
- Major Support Zones: $125, $100, $75
Ethereum (ETH) Price Analysis Jan 09, 2020
Last week, Ether, the second-largest coin in the crypto market commenced a bullish move at the low of $126. Meanwhile, before this time, the pair had been trading at the bottom of the chart because of the resistance at $136. The bulls have made three unsuccessful attempts at the resistance without breaking it. Fortunately, on January 5, the resistance level was breached. The price went up to a high of $148 but was resisted.
The cryptocurrency is facing a lack of buyers at higher price levels. The market fell to a low of $136. There are chances that ETH will move up again if the current support holds. We expect the price to break through the current resistance and reach a high of $157. The danger here is that if the selling pressure resumes, the market will fall to $122 low.
ETH Technical Indicators Reading
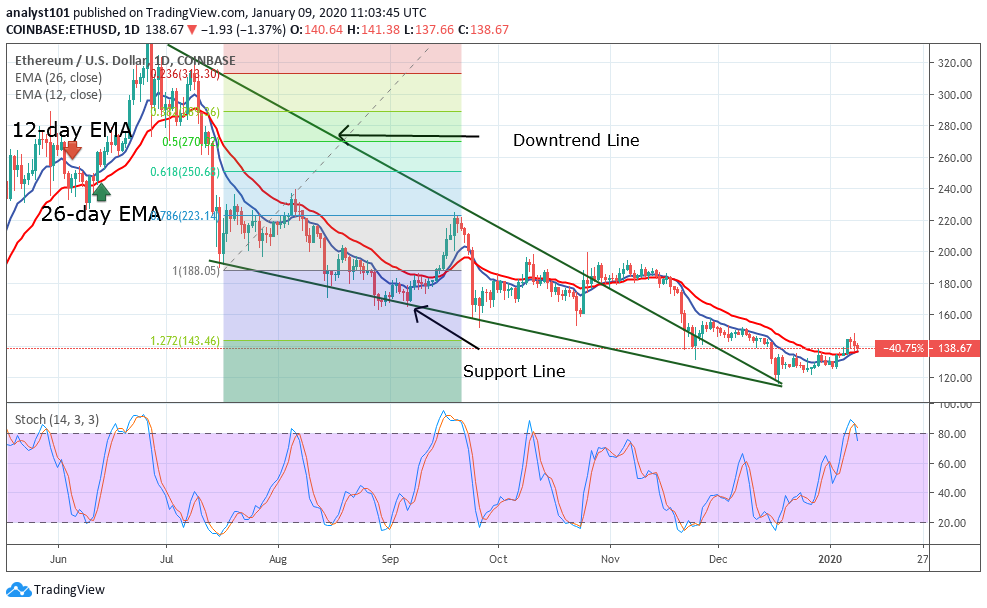
The price bars are currently above the 12-day EMA and the 26-day EMA indicating that the bullish move may continue. Ethereum has reached the overbought area of the daily stochastic. The stochastic bands are making a U-turn below 80% range. This implies that Ethereum may likely fall.
Conclusion
Ethereum may continue its downward move. The stochastic has indicated that Ether has been overbought as the bands make a U-turn. We are waiting for the price to break below the EMAs. This will confirm whether the coin is falling. Nonetheless, if the market remains at its current level and holds, ETH may rise or be in a sideways trend.