DOGE Price Analysis of March 12, 2025: DOGE Recovers from $0.1450, Is a Bullish Breakout Above $0.1700 Possible Today?
Let’s delve into DOGE price analysis for March 12, 2025, and understand the underlying indicators, thereby discovering future probable trends and breakouts.

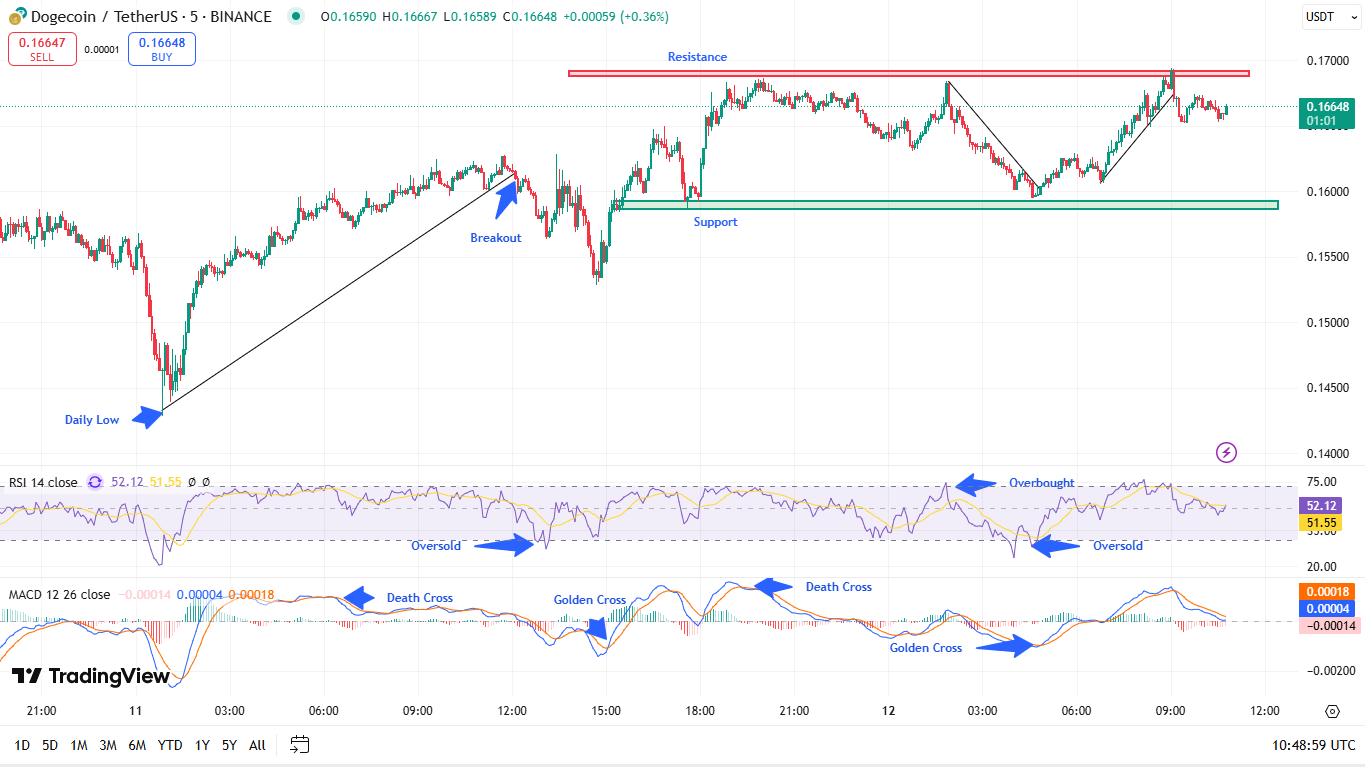
Are you thinking of investing in Dogecoin and looking for a DOGE price analysis? As of March 12, 2025, the DOGE price trend on the 5-minute chart exhibited a well-defined structure with key levels of support at approximately $0.1600 and resistance around $0.1700. A significant daily low was formed near $0.1450, from which a strong bullish move emerged. This initial breakout above the previous resistance triggered an upward trend, as indicated by a sharp incline in price. The MACD and RSI indicators provided crucial insights into momentum shifts and potential trade opportunities throughout the observed time frame.
Analyzed by baishnabtriparna, published on Tradingview on March 12, 2025
DOGE Price Today: MACD Analysis
The DOGE price analysis through the MACD indicator produced various trading signs that tracked price behavior correctly. The indicator displayed its first Death Cross during the early portion of the chart, which indicated bearish price action. A Golden Cross formed after the price showed a significant rebound, signaling the start of bullish market conditions. price growth extended beyond the $0.1600 resistance.
The price reached the $0.1700 resistance area while a new Death Cross appeared, which matched the market peak. Such momentum indicators revealed weakening market strength, which suggested an upcoming price reversal. A brief Golden Cross appeared following the Death Cross, but just enough to boost another upward push, which did not hold above $0.1700, so the price started descending again.
DOGE Price Trend: RSI Analysis
The RSI indicator of the DOGE price today functioned to back up trading indicators during market assessments. During this period, RSI reached the oversold stage at $0.1450, which matched the period of robust price recovery. The market situation during this period made it an excellent time to purchase assets. RSI reached the overbought zone near 75 during the price rally that approached the $0.1700 resistance level, thus predicting a market correction.
ERSI entered oversold space near $0.1600, which coincided with another upward price movement. The $0.1600 support proved resilient, thus providing another advantageous buying moment for participants. The market maintained a range between $0.1600 and $0.1700 because it alternated between being overbought and oversold states.
DOGE Price Analysis: Buy and Sell Signals
The trading indicator produced a purchase signal after the market price recovered from $0.1450 because RSI rebounded from oversold positions, and MACD displayed a Golden Cross pattern that signaled rising bullish strength. The price reached $0.1600 during its retracement phase, and the RSI entered oversold space from which it bounced higher. Many traders used this price area as their main buying opportunity.
The price approached $0.1700 and triggered a brief trading chance as RSI surpassed overbought conditions along with MACD’s formation of a Death Cross which signaled decreasing momentum. The price demonstrated falling momentum when it could not maintain its upward trajectory at that point, which propelled it downward toward $0.160$0.
The established support at $0.1600 and resistance at $0.1700 could be exploited through a strategic buying plan near $0.1600 and a selling strategy near $$0.170$0. Investors who purchased positions near the $0.1600 level as RSI displayed oversold conditions would have achieved profits due to the subsequent price rise toward $$0.170$0. Selling near $0.1700 based on overbought RSI levels would have been a suitable selling point before price corrections occurred.
DOGE Price Prediction and Trading Opportunities
During the trading time the market demonstrated robust price movement in a discernable trading space from where multiple potential gains emerged. MACD and RSI together generated effective signals that allowed traders to execute both buy and sell decisions impacting their positions. The price level of $$0.1600, tested multiple times, confirmed its robustness, and $$0.1700 established itself as a strong barrier to potential price advancement. Professional traders would succeed in managing this price movement when they stick to their strategic combination of momentum indicators and support-resistance levels.
Follow us on Google News
Get the latest crypto insights and updates.
Related Posts

Crypto.com Partners With KSNET to Enable Crypto Payments for South Korea Tourists
Mikaeel
Author

Bitget Unveils New Onchain Tokens Amid Rising Search for 100x Crypto Gems
Hanan Zuhry
Author

BitGo MENA Expands into UAE with Full Regulatory Approval
Emmmaculate Araka
Author
Loading more news...