


Over the last twenty days, the crypto market failed to meet the expectations of traders as most assets were locked in a trend. This pattern ended a few hours to the time of writing.
During this time, several cryptocurrencies shot past their trading channels and reclaimed key levels. Some of the top assets that had this breakthrough are Bitcoin and Ethereum.
Bitcoin Flipped $30k for the First Time Since June
The chart below shows that the top asset was trading between the $28k and $27k channels. This took place for more than 20 days until a true breakout during the previous intraday session. Flipping the $29,000 resistance was one of the moves that signaled the start of the bullish round.

Nonetheless, it is worth noting that this is not the first time the top asset broke this level over the last thirty days. As with previous attempts,. the move was met with a lot of uncertainty and many wondered if BTC may retrace as it did in previous instances. However, when it peaked at $29,798 (the highest in almost a year), $30k was also on the radar.
The $30k resistance gave way at midnight UTC sparking a lot of reactions from traders. With many posting memes on Twitter to celebrate the latest feat. Others are calling the latest move the end of the bearish dominance. Let’s see the impact on indicators.
The first to examine is the Moving Average Convergence Divergence. Over the last thirty days 12-day EMA and the 26-day EMA were mostly bearish. Following the negative divergence on March 28, the metric is showing huge signs of recovery. At the time of writing, we are seeing a bullish convergence which may signal more price increases in the coming days.
The Relative Strength Index is also improving. It is currently above 70 after spending some time below 60.
Ethereum Eyes $2k
The second largest cryptocurrency by market cap is back above $1,900. This is no surprise as Ethereum flipped the level a few days back. Shortly afterward, it went on a three-day downtrend before recovery.
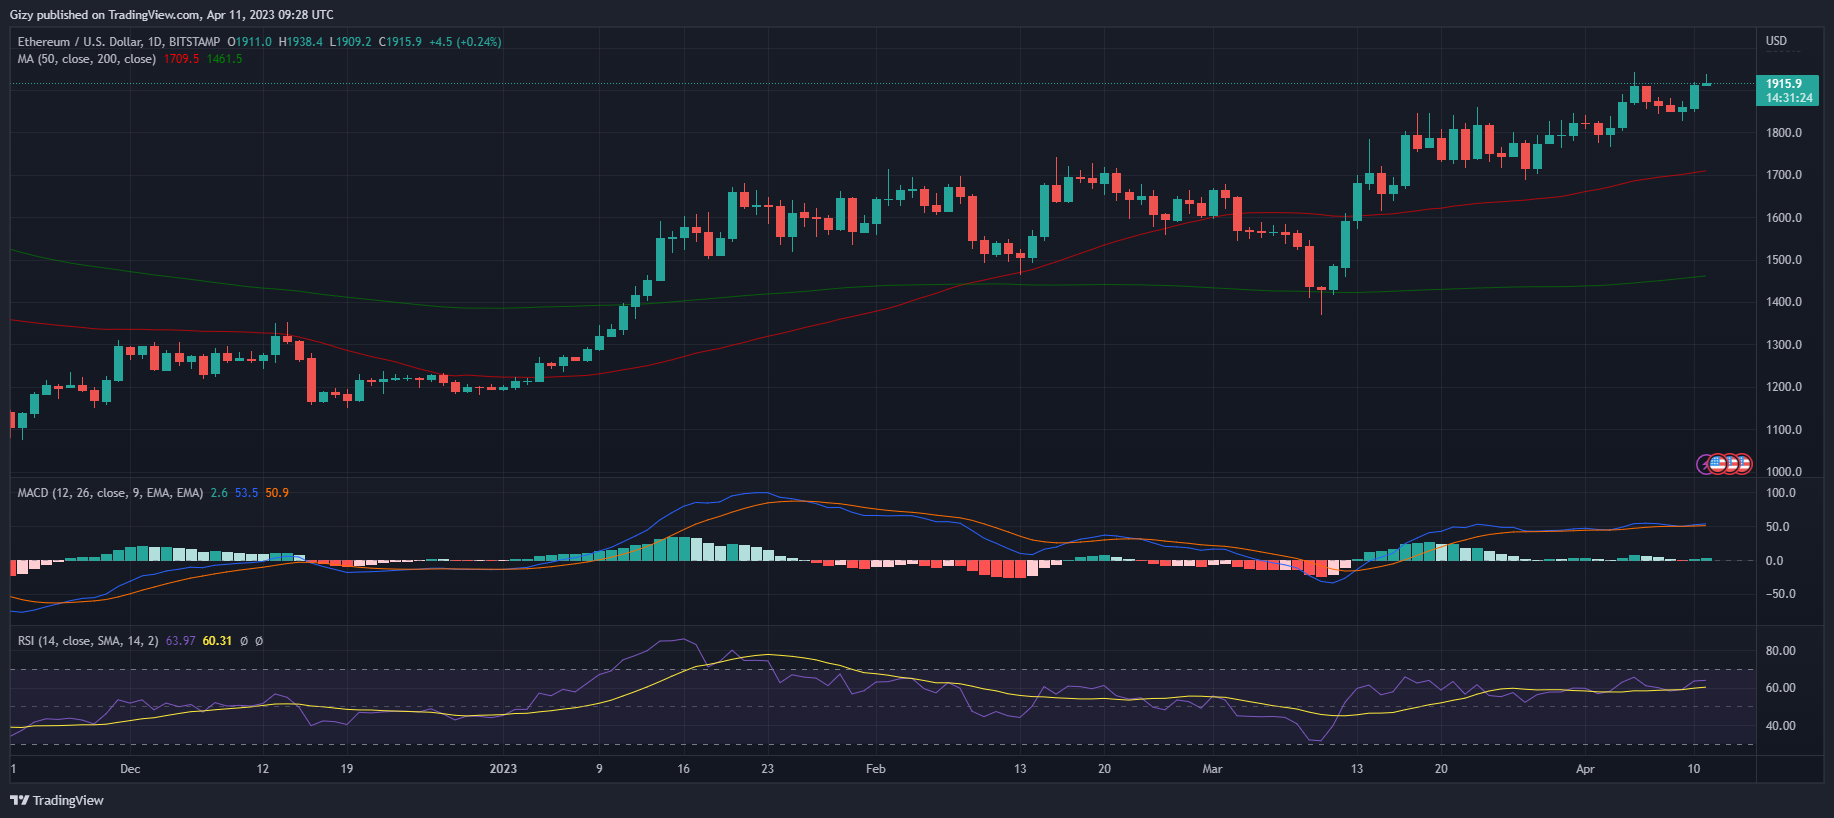
Nonetheless, the latest move points at another key resistance in ETH’s bid for $2k. During the previous attempt, the top alt retraced at $1,942. This time, it met a strong wall at $1,938. This is an indication of a drop in demand concentration between $1,940 and $1,950. Breaking this barrier may guarantee that the $2,000 resistance flips.
However, the indicators are looking different from what we see in other assets in the crypto market. They are mostly bearish. One such is the Moving Average Convergence Divergence.
Readings on metric point to an impending bearish divergence which may signal the start of a bearish round. Nonetheless, RSI remains below 70.