Chainlink Price Analysis of March 10, 2025: LINK Plunged from $15.60 to $13.60, Can it Recover?
Let's dive into then Chainlink price analysis of March 10, 2025, and explore the reason behind the sudden fall in the Chainlink price trend.

If you are tracking Chainlink and wondering what caused the sudden fall in the Chainlink price trend, then you’re at the right place. As we go through the analysis, we explore different types of patterns and how RSI and MACD reacted and helped in the formation of the pattern. Chainlink shows bearish sentiment, with some bullish momentum seen in the Chainlink price today. Without further delay, let’s dive into Chainlink price analysis and find out what’s going on in Chainlink price today.
Chainlink Price Analysis of the Last 24 Hours
At 03:25 UTC, the price broke out to the upside from a downward-moving channel, further corroborated by MACD. At the same time, the price formed a converging triangle. At 03:50 UTC, RSI showed an overbought market condition, and at 05:20 UTC, a death cross appeared in MACD, both suggesting a pullback or a reversal. The converging triangle broke out to the downside at 05:40 UTC and formed another spike.
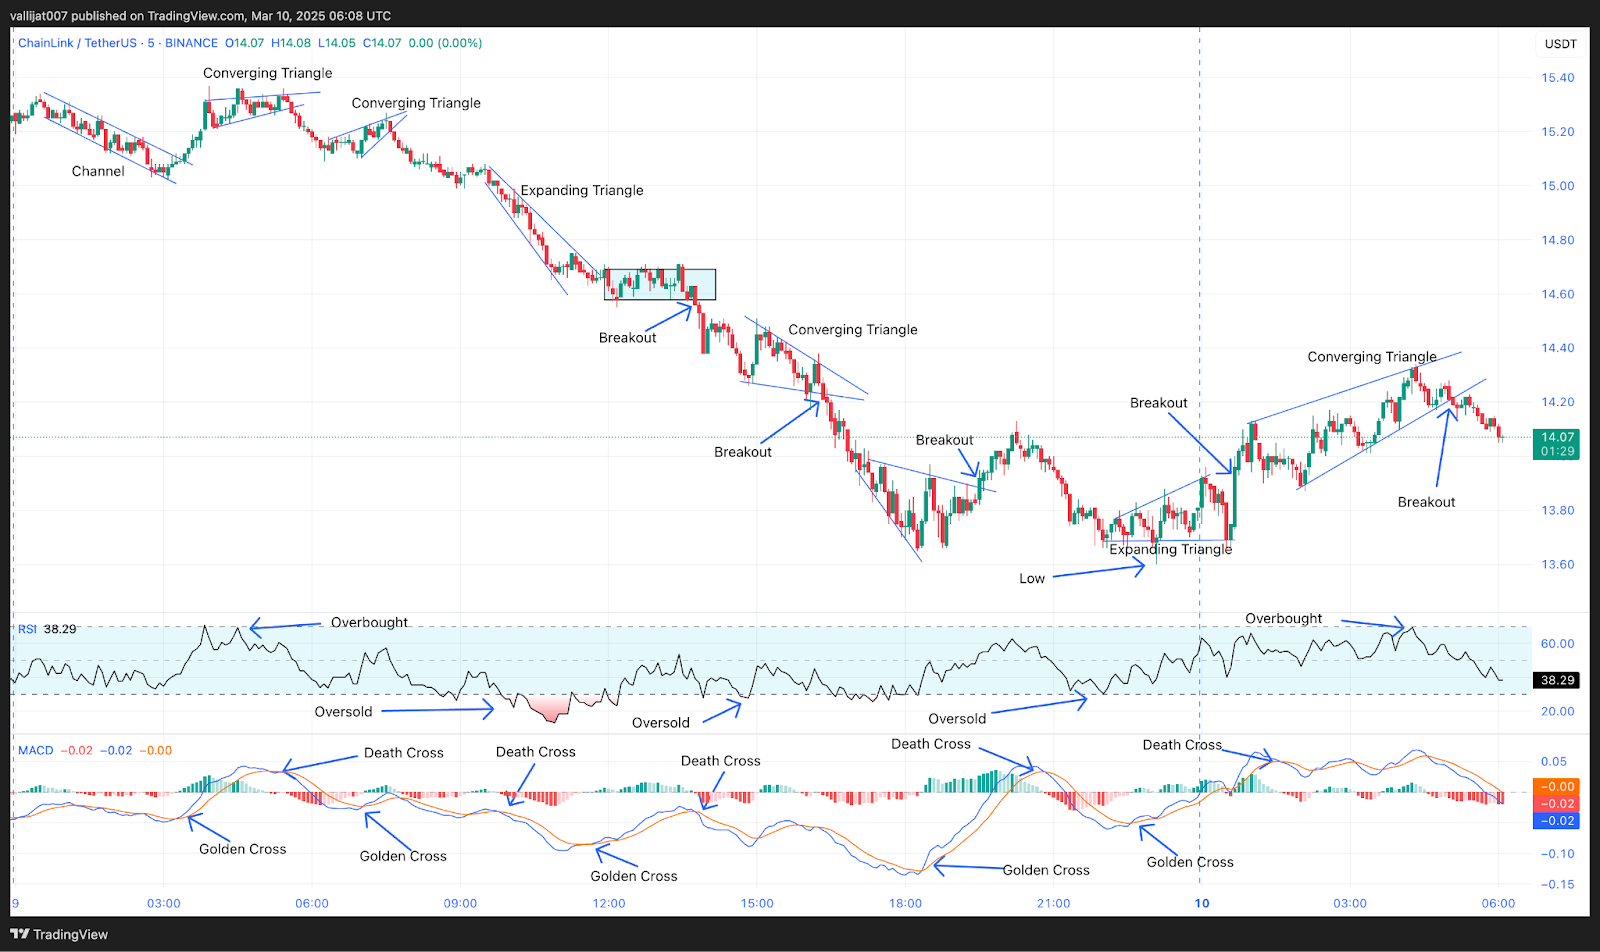
Chart 1: Analysed by vallijat007, published on TradingView, March 9, 2025
Based on Chainlink price analysis, a golden crossover at 07:00 UTC helped in the formation of a converging triangle. This converging triangle also broke out to the downside and formed a spike to the downside. At 10:00 UTC, RSI showed an oversold market condition, and MACD showed a death cross at the same time, both supporting the formation of an expanding triangle. The expanding triangle broke out to the upside and formed a range. At 13:45 UTC, the range broke out to the downside, corroborated by a death cross in MACD at the same time; the price formed a spike and a converging triangle.
Chainlink Shows Bearish Patterns with Short-Term Bullish Signals
The converging triangle again broke out to the downside at 16:20 UTC, corroborated by a death cross in MACD. In the meantime, RSI continuously broke below the level of 30, indicating an oversold market condition. At 18:20 UTC, a golden crossover appeared in MACD, helping in the formation of an expanding triangle. The expanding triangle broke out to the upside at 19:30 UTC but failed to form a channel—only a spike was seen. At 20:50 UTC, a death cross appeared in MACD, which pushed the price to the downside, and a golden crossover at 22:40 UTC helped in the formation of an expanding triangle.
The expanding triangle broke out to the upside at 00:40 UTC, corroborated by a golden cross in MACD. At the same time, a death cross appeared at 10:50 UTC, indicating a reversal or pullback in this short-term bullishness in Chainlink price today. A converging triangle appeared on the chart, which broke out to the downside at 05:05 UTC. If this breakout succeeds, then the price may reach its low at $13.60. If this breakout fails, then the converging triangle top would be tested at $14.35.
Chainlink Downtrend Shows Recovery Potential
Chainlink shows a downtrend with the potential to recover. As Chainlink is trading near its previous low, it could be tested, and if the price recovers from this level, the recovery may be rapid. If Chainlink fails to move to the upside and also fails to break its low, then Chainlink could trade in a range-bound market for some time. Traders and investors are encouraged to take a look at the Chainlink price trend by themselves because the crypto market is subject to potential risk.
Follow us on Google News
Get the latest crypto insights and updates.
Related Posts

Flow Blockchain Targets 1 Million TPS as It Reimagines Web3 Infrastructure
Triparna Baishnab
Author

Sui Network Unshackles 117M Tokens from Market Makers — Powers Up Web3 Like Never Before
Triparna Baishnab
Author

Sei Network Pays You to Read? Inside the ‘Read to Earn’ Quest That’s Shaking Up Blockchain Learning
Triparna Baishnab
Author
Loading more news...