Chainlink Analysis: LINK Fails to Flip $15 Amid Massive Whales Activities
By
Gideon Geoffrey
Chainlink is currently on a downtrend after it failed to break a critical resistance. It opened trading at $14.5 but experienced small increases that saw it test $15. However, it failed to break through as it faced strong rejection at $14.9. Breaking down the chart into a 2-hour timeframe, it becomes clear that the altcoin […]

Chainlink is currently on a downtrend after it failed to break a critical resistance. It opened trading at $14.5 but experienced small increases that saw it test $15. However, it failed to break through as it faced strong rejection at $14.9.
Breaking down the chart into a 2-hour timeframe, it becomes clear that the altcoin had most of its movements in the early hours of the day. After this significant push, it struggled to hold prices above $14.4. Nonetheless, on the daily chart, LINK may close the session with no notable changes in value.
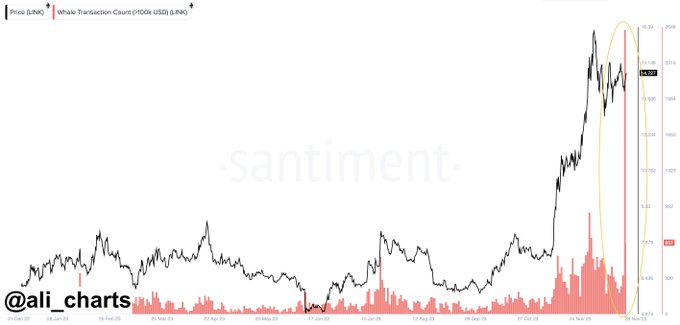
This comes as a shock to many as the coin attained a fresh milestone during the previous intraday session. According to the reports, it had its largest spike in whale transactions for the year. More than 2,600 of the total transactions on the chain were above $100,000. This is a clear indication of large players’ interest in the asset. As a result, many expected a significant boost in price.
Another observer made a distinction that the majority of the whale moves were on older coins and addresses. They claimed that “big older coin movement typically is followed by big price movements.” They also presented one such occurrence that took place in September and saw the altcoin gain more than 31% during the following two weeks.
No New Signals on Chainlink Charts
Since having its bearish divergence on November 14, the Moving Average Convergence Divergence has shown no other important signals. A closer look at the indicator reveals that the 12-day EMA continued its downward as well as the 26-day EMA. Although silent, MACD is a trend indicator mirroring the current state of the asset.
The Relative Strength Index is another silent indicator. Currently below 70, the metric dropped as low as 51 but recovered and is closer to 60. This is a clear indication of an increase in buying volume. If market conditions continue to improve, RSI will rise.
Key Levels to Watch
Vital Support: $13, $10.5, $7.2
Vital Resistance: $15.5, $17, $18
With many expecting a bullish outcome in the coming days, its best to look at critical resistance. One such is the $15.5. Over the last fourteen days, the mark came under several tests. However, none were successful as most retraced at $15.4. It is also worth noting that the coin flipped the highlighted barrier earlier this month.
Gaining stability above $15.5 will guarantee a retest of the $17 resistance. Previous attempts at this critical level failed to yield results as LINK retraces at $16.8. This means the asset will linger for a bit around the previous mark before moving forward. Afterward, it may test $18. These forecast are expected to play out within the next two weeks.
On the other hand, worsening trading conditions may send chainlink as low as testing the first critical support at $13. While its noted that it held out against several tests, breaking it may lead to more downtrends as the next strong barrier is at $10.5.
In previous times, the said barrier became a launchpad to retest key resistance. This points to a significant demand concentration around it. Although tough, the barrier the most important as a flip may result in a decline to $7.2.
Follow us on Google News
Get the latest crypto insights and updates.