


Bitcoin continues to intrigue both investors and enthusiasts. However, many are left guessing the next price action. The sheer amount of speculation caused many traders to panic while others went with the flow. Trading action over the last two weeks was mixed with both positive and negative moments; leading to more confusion.
Two weeks ago, the top coin closed with losses of more than 7%. This was due to a massive downtrend it experienced Thursday. It dipped by more than 5% and failed to recover.
The previous week offered more from a bullish perspective. Although it had a red candle on the first day, it bounced back with an increase of almost 2% the next day. This also marked the start of a two-day hike.
The main highlight of the session was on Wednesday when BTC recorded one of its biggest increases. It opened at $22k and retested the $24k resistance. it flipped it and closed above the barrier; registering gains of more than 9%.
On the weekly scale, it closed with a positive change of 11%. In addition to these changes in value, we also noticed a positive impact on indicators.
For example, the Moving Average Convergence Divergence had an interception during the period under consideration. The Relative Strength Index also returned above 60; an indication of healthy buying pressure.
Many concluded that this was the end of bearish dominance following bullish readings. Here are the reasons why the current price increase could be a bull trap.
Bitcoin CME Gap
The CME gap is one of the most reliable tools to analyze possible lows or highs of an asset. With regards to bitcoin, it is not silent.
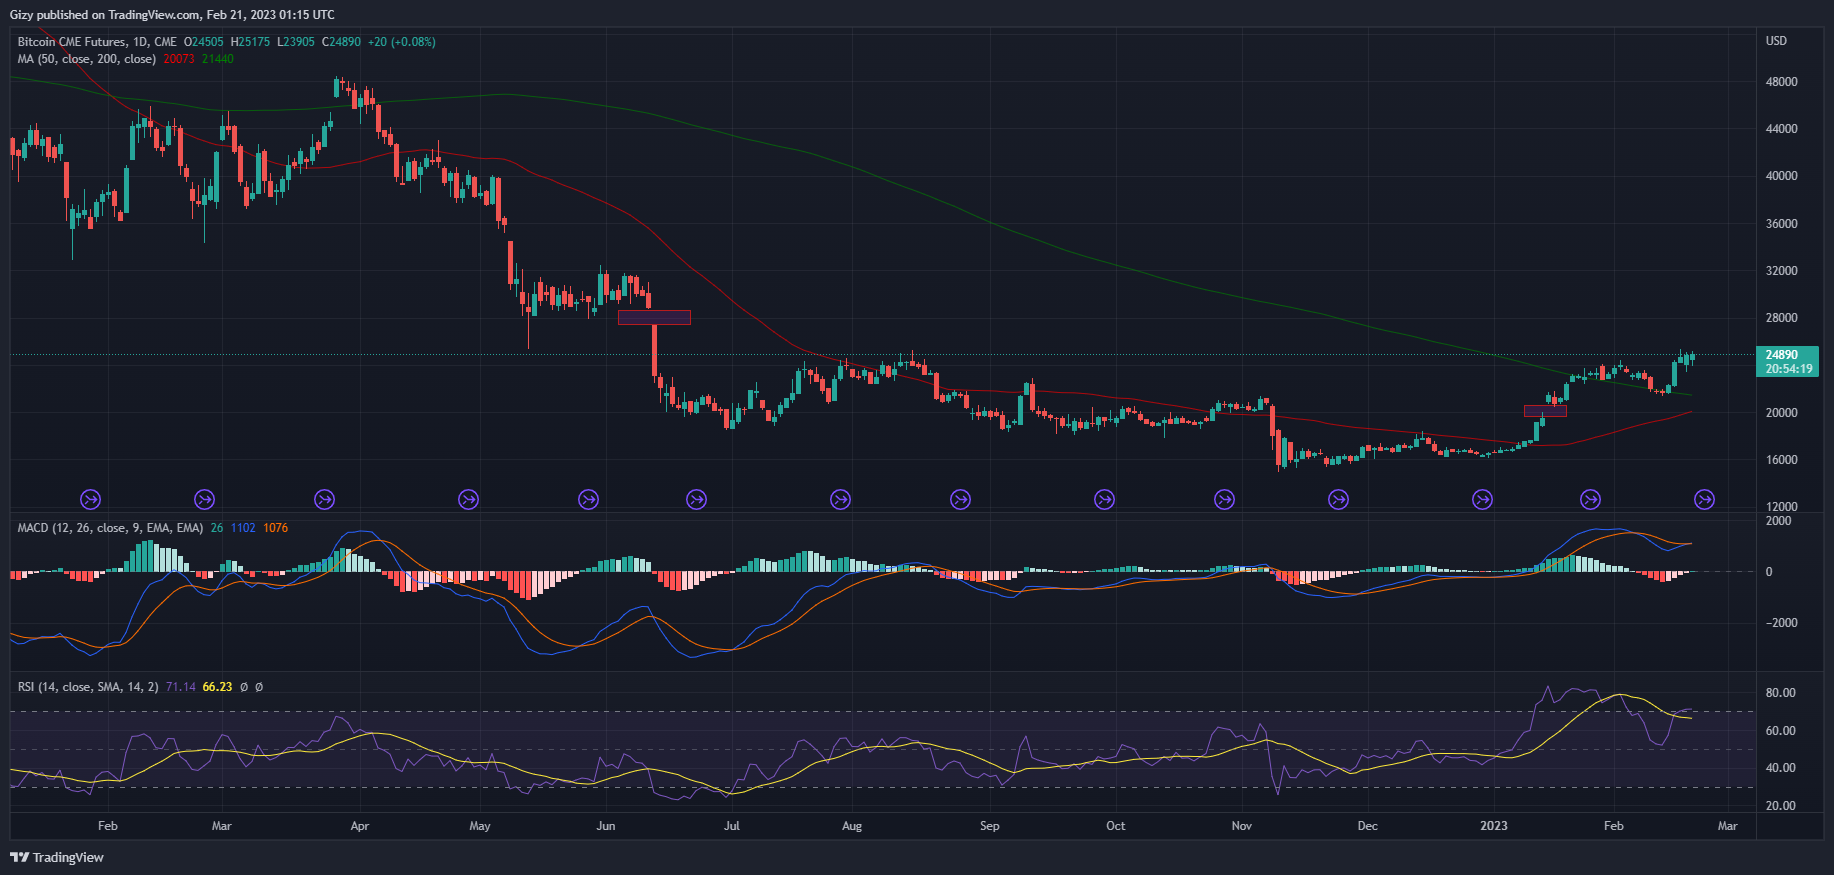
On the BTC futures chart, we noticed two CME gap that may get filled in the coming days. One is to the top, while the other is down; indicating a possible retest of a key support.
The image above displays a gap between $20k and $19k. We also notice another one between $27k and $28k. It is hard to predict which of them will see BTC price correlation. However, the fact that it is possible for the apex coin to dip as low as $19k is an indication that the current uptrends won’t last long.
We may also see the largest cryptocurrency by market cap break the $28k resistance before testing the $19,000 support. Anyway it plays out, a drop below $20k is one that many dread.
Large Wallet Inflow
Over the last two weeks, exchanges saw a large inflow of BTC from offline wallets. Based on previous moments like this, this is a two-edged sword. In some cases, it played in the favor of the bulls. In other cases, it played in favor of the bears.

Nonetheless, it is mostly bearish. The chart above shows multiple bubbles, indicating the influx of the asset into crypto exchanges. The last time this happened, the coin dipped by more than 10%.
A case study is December when we noticed one of the biggest bubbles in the figure. After this phenomenon, we observed the massive downtrend that followed. If the same takes place, it may tally with the CME gap prediction.
With these factors in mind, let’s go over key support and resistance.
Key Levels to Watch
Key support: $20,000, $15,000
Key Resistance: $25,000, $30,000
While the highlighted barriers are major ones in relation to the current price, there are other historic levels. One such is the $18k support.
It held out against several attempts for more than three months. Afterward, it became the launchpad for trials at $20k. When it failed, we saw a price dip as low as $15,000.
While many analysts speculate that the top asset may dip as low as $1ok, it is worth noting that this action may face strong resistance at $15k. Historically, it has been serving as a positive barrier for more than a year now.
While these barriers are important, the closest to the current price action is $20k. All eyes are on the mark as a flip may signal a chain reaction. With the CME gap in mind, we may conclude that a retest is almost inevitable.
On the flip side, we may expect attempts at key resistance. The first negative barrier to look out for is $25,000. Although BTC surged above the level more than twice over the last seven days, it remains a critical level as the apex coin failed to remain above it.
It is also worth noting that there is also considerable resistance $28k. Nonetheless, after breaking the mark, it is almost a guarantee that bitcoin will retest the $30k resistance.