Bitcoin Price Analysis of March 13, 2025: BTC Faces Selling Pressure After Failing to Break $84,219 Resistance
Let’s Dive into the Bitcoin Price Analysis of March 13, 025, to understand BTC's market trends and investment potential in 2025.

Are you tracking BTC price today and wondering where it’s headed next? The latest Bitcoin price analysis shows ongoing market fluctuations, with BTC moving within an upward channel, facing breakout attempts and potential breakdown risks in the past 24 hours. While bullish momentum suggests the possibility of testing key resistance, bearish signals indicate downside risks. With traders closely watching its movement, the Bitcoin price prediction focuses on crucial support and resistance levels that will define its next move. Will BTC sustain its recovery or face another rejection? Let’s dive into today’s market action.
Bitcoin Bulls Struggle at $84,219 Resistance, Finding Support at $80,789
The trading day of March 12th opened with bullish momentum, driven by a golden cross that initiated an upward trend. At 1:50 UTC, an overbought RSI condition pushed the price higher, but a death cross at 2:05 UTC reversed the trend, leading to a downward move. Selling pressure increased, causing BTC to drop further, with oversold RSI signals at 4:00 UTC and 4:40 UTC indicating weak momentum. By 7:20 UTC, a golden cross on the MACD signaled a bullish shift, driving the price toward $84,539.94 at 12:30 UTC.
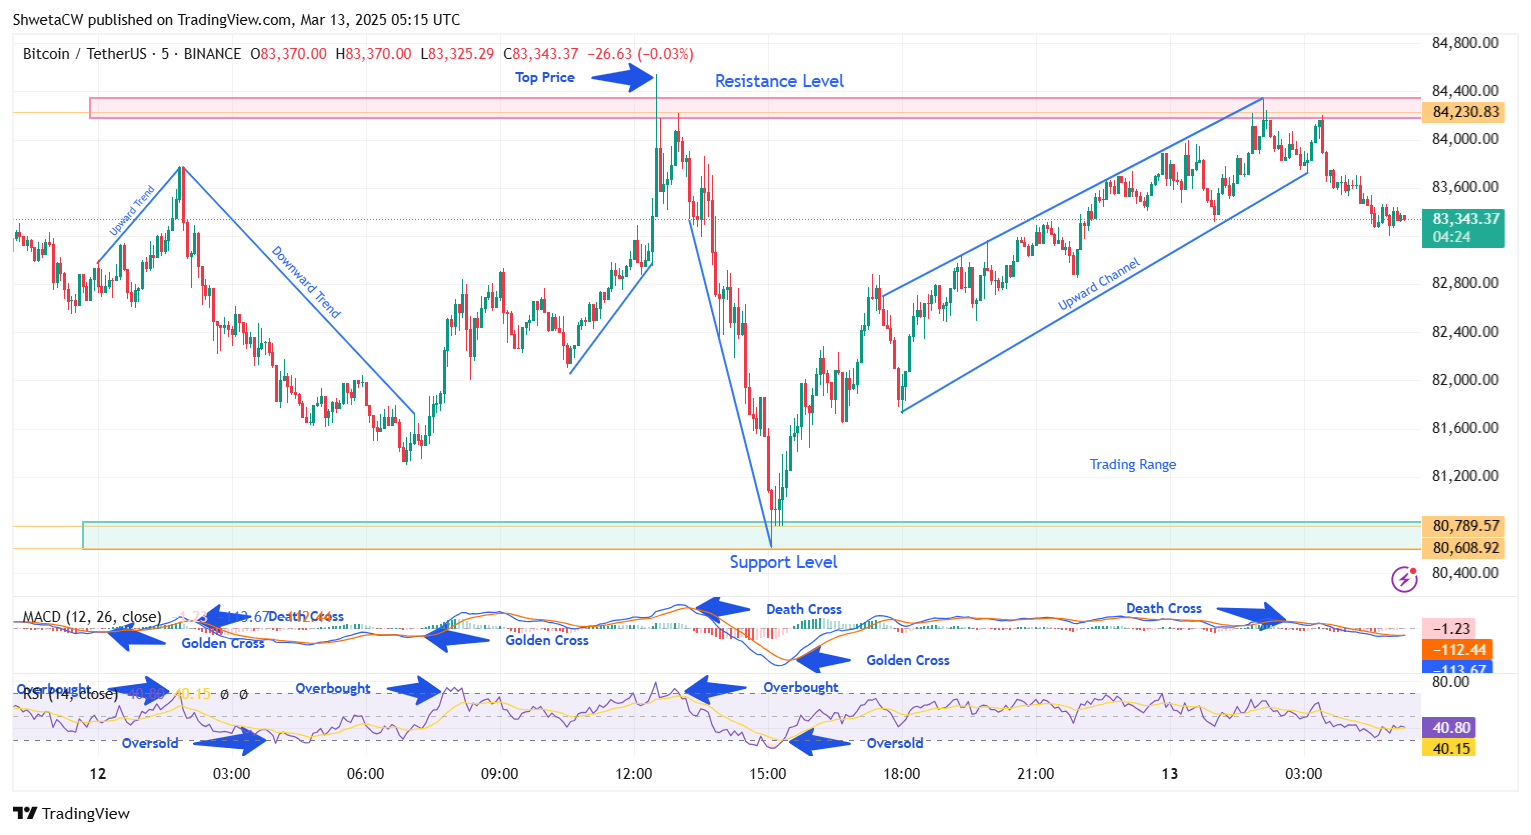
Chart 1, Analyzed by ShwetaCW, published on TradingView, March 13, 2025
However, resistance at $84,219.69 led to rejection, reinforced by an overbought RSI at 12:55 UTC. A death cross at 13:15 UTC triggered sharp fluctuations, sending BTC downward. Oversold RSI conditions at 14:40 UTC and 15:10 UTC pushed the price to $80,608.92, but strong support at $80,789.57 stabilized the decline. By 15:30 UTC, a golden cross on the MACD reignited buying pressure, leading to a moderate upward move within an ascending channel. Despite ongoing fluctuations, BTC maintained an overall bullish bias heading into the next session.
Bitcoin Price Analysis Today
The trading day of March 13th began with moderate trading move within an upward channel, driven by the previous day’s golden cross. The bullish momentum continued into the morning, leading to another golden cross at 1:35 UTC. This fueled a breakout attempt, pushing it to $84,336.71, but resistance held firm, preventing further gains. A death cross at 2:25 UTC suggested increasing selling pressure, pulling the price back into its previous trading range and starting a downward trend. With volatility persisting, traders are now watching key support levels to determine if BTC will stabilize or continue its decline.
Bitcoin Price Prediction
The Bitcoin price analysis highlights ongoing volatility, with BTC experiencing upward and downward trends in the past 24 hours. If selling pressure increases, BTC may break below the $80,789.57 support, potentially triggering further downside. However, if bullish momentum builds, the price could reverse upward, testing the $84,219.69 resistance. A breakout may push BTC price today toward the $84,400–$84,600 range, signaling renewed strength. Traders should monitor key levels closely, as market sentiment remains uncertain, and the next move will determine the Bitcoin price prediction for the short term.
Follow us on Google News
Get the latest crypto insights and updates.