


Bitcoin price performance over the last 360 days was one of the worst. Nonetheless, depending on the perspective it could also be good news as the bears are grinning hard after three consecutive years of massive price increases.
2022 is coming to an end with the apex coin still struggling to hold onto key levels. Currently trading above $16k, it is safe to conclude that this is the worst year since 2018. A closer look at price movement tells another story.
2022 price performance has a close semblance to 2018. Many argue this is wrong, but let’s review some factors.
Increased Adoption
The year started with many agreeing that this was the start of crypto winter. Several analyses in December 2021 and early January also pointed to this happening. One stated that although it is hard to come to a conclusion as to how BTC will perform, there are clear indications that bears are edging.
Most traders never anticipated a drop to the current value. Using the CME gap many looked to a drop between $32k and $28k. On the bullish side, Nayib Bukele, the president of El Salvador, is still optimistic about Bitcoin and believes that in 2022, the price of the most popular cryptocurrency would reach $100,000.
As a result of these conclusions, the drops in January had very little impact on the bull. We saw an increase in adoption as several organizations announced the use of BTC for one purpose or the other.
One such was blockchain company BTCS revealed plans to start accepting “Bividend,” or Bitcoin dividends. By doing this, BTCS will become the first firm with a Nasdaq listing to provide these services to shareholders.
New York Digital Investment Group (NYDIG) and Computer Services Inc. (CSI), a top provider of fintech solutions, also came together to enable bank users to purchase, exchange, and keep bitcoin (BTC).
Rio de Janeiro became the first South American city to purchase Bitcoin as a store of value, as well as the first city in Brazil. To aid soldiers in the ongoing confrontation with Russia, Ukraine’s non-governmental organizations (NGOs) and volunteer groups have raised $4 million in bitcoin donations.
A bill regulating the usage of Bitcoin has been unanimously approved by the Central African Republic (CAR), making it the first such nation on the continent. Próspera, a special economic zone in Roatan, Honduras, declared Bitcoin and other cryptocurrencies to be legal cash within its borders.
These stories of bitcoin usecases kept hope at its peak. However, several events took place that led to Fear, Uncertainty and doubts.
Massive Bearish Fundamentals
Along with the adoptions, we also saw several governments try to fight the apex coin. The “Accountability for Cryptocurrency in El Salvador (ACES) Act” was introduced by Congresswoman Norma J. Torres and Congressman Rick Crawford. The proposed legislation aims to reduce the potential risks connected to El Salvador’s Bitcoin law.
A new policy in the European Union called Markets in Crypto-Assets (MiCA) aimed to restrict the usage of cryptocurrencies with a proof-of-work (PoW) algorithm, like Bitcoin and Ethereum.`
Tesla also sold 75% of its bitcoin bag during the second quarter. It announced the dump of more than $900 million worth of BTC sometime in June. Aside from these major stories, BTC also grappled with the effect of the consistent hike in interest rates.
It also saw a massive decrease in value due to the collapse of the second-largest crypto exchange. None of these fundamentals were present in 2018. Nonetheless, the price chart says otherwise.
2018 vs 2022
Before going in-depth on how BTC performed over the last 360 days, let’s compare the two charts below. They are both 1-day charts and cover price movements of one year. The first is for 2022 and the second, for 2018.

2022 Price Chart
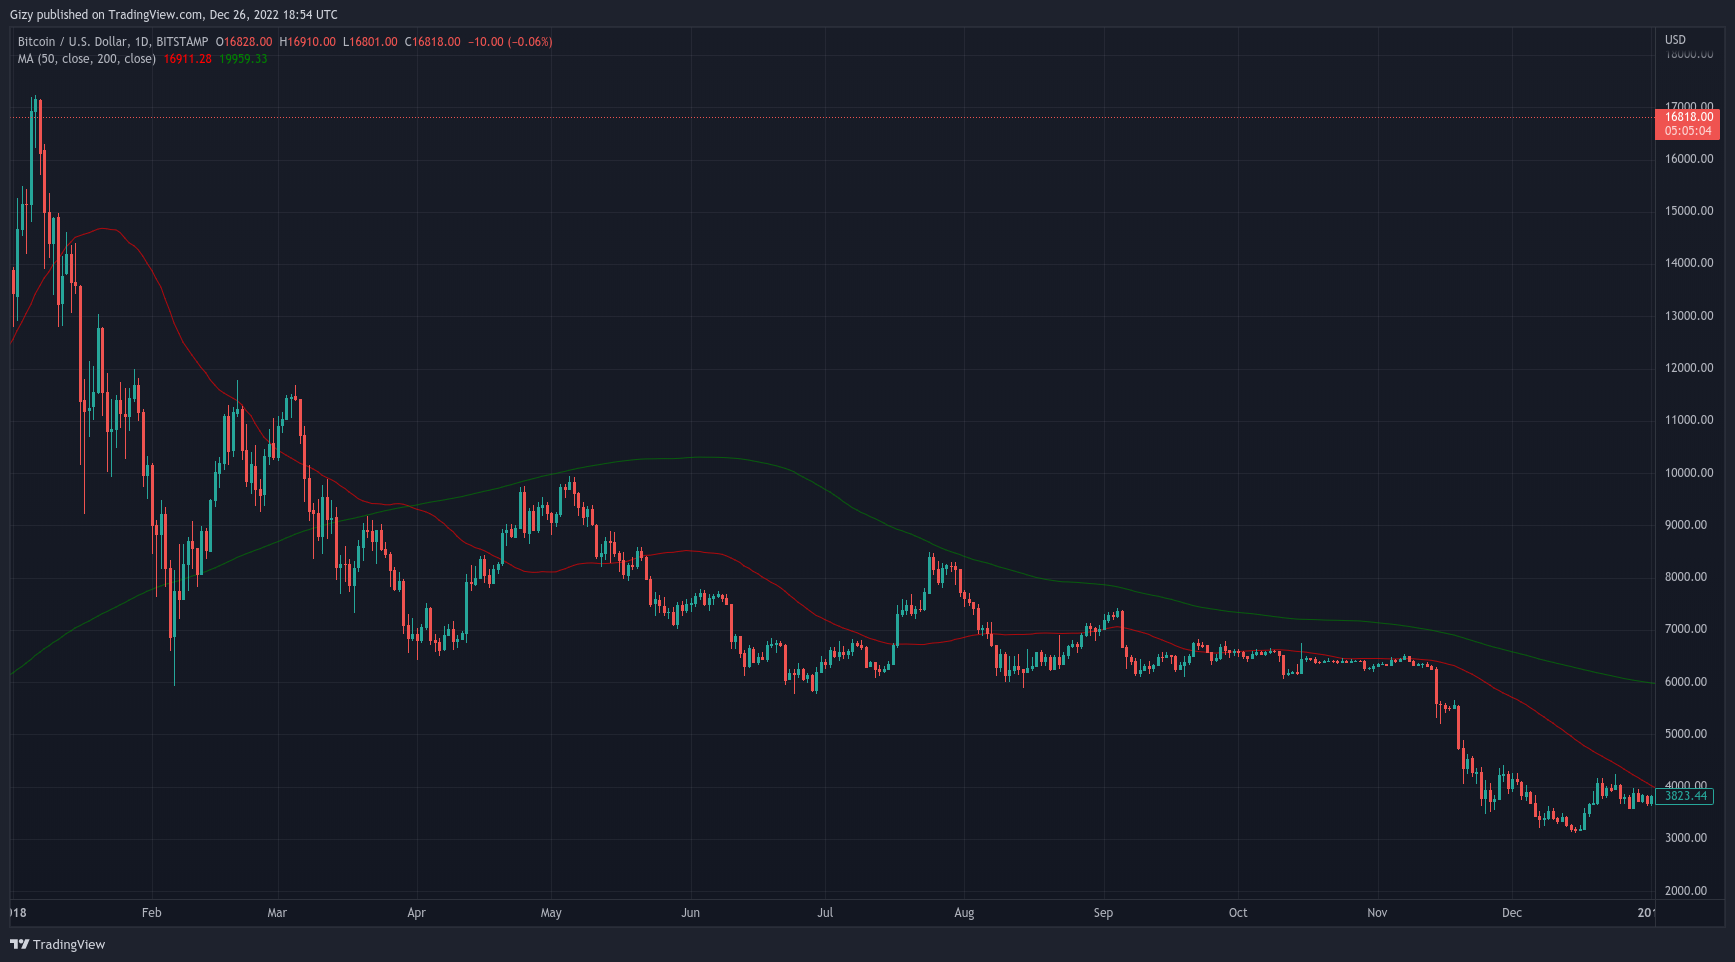
2018 Price Chart
We notice the close semblance between 2018 and 2022. Like in ’18, every month came with a huge drop or increase in price. For example, on January 21, BTC dipped by more than 10%. This happened after a more than 6% drop a few days ago.
In February, one of the biggest moves was bullish as the coin surged by more than 11%. A few days later, it dipped by more than 7%. Another massive increase happened a few days to the end; a 14% pump.
In March, BTC had one of its most bullish periods. It surged by more than 8%. Starting Mar. 22 to 29, it accumulated more than 17% in profit. During the next month, there were massive moves from the asset.
May was filled with so many downtrends as BTC lost more than 25% in five days. In June, the biggest move happened on the 13th as the coin dipped by more than 15%. The next 30-day period was not eventful like the previous one.
10% drop in August and another in September sealed another massive drop for the coin. November came with one of the biggest drops of the year. It lost more than 23% in 48 hours. After these massive drops, there were no significant moves.
Bitcoin Worst Performance in Four Years
The last time BTC closed the year with losses was in 2018. During this period, the coin closed with losses of more than 70%. It also followed the same sequence as the present year. 2022 is another bearish period for the coin under consideration.
A look at the monthly tells more about the story. We noticed that the apex coin had a very bad start to the year. January was one of the most bearish as it lost more than 15%. The most bearish of the timeframe under consideration was November.
Bitcoin lost more than 33% during this period and is showing no notable signs of recovery. Of the 12 months, only four came out positive. In the end, BTC may close 2022 with losses of more than 60%.