Bitcoin’s Volatility Rises as Long-Term Holders and Miners Sell Off
By
Pedro Augusto
This extensive sell-off in the Bitcoin market has compounded the pressure on the market, increasing volatility and uncertainty.

In recent weeks, Bitcoin has faced significant challenges, marked by considerable selling pressures that have instigated concerns regarding its short-term stability.
This turbulence has been primarily fueled by major sell-offs from long-term holders, early miners, and managers of Bitcoin Exchange-Traded Funds (ETFs), who collectively have divested billions of dollars in Bitcoin.
Impact of Large-Scale Liquidations
The impact of these large-scale liquidations has been significant, with long-term holders alone offloading approximately $1.2 billion worth of Bitcoin over the last two weeks. This extensive sell-off has compounded the pressure on the market, increasing volatility and uncertainty.
Ki Young Ju, the CEO of CryptoQuant, a blockchain analytics firm, pointed out that such substantial amounts of sell-side liquidity need to be absorbed through over-the-counter transactions to prevent further market destabilization.
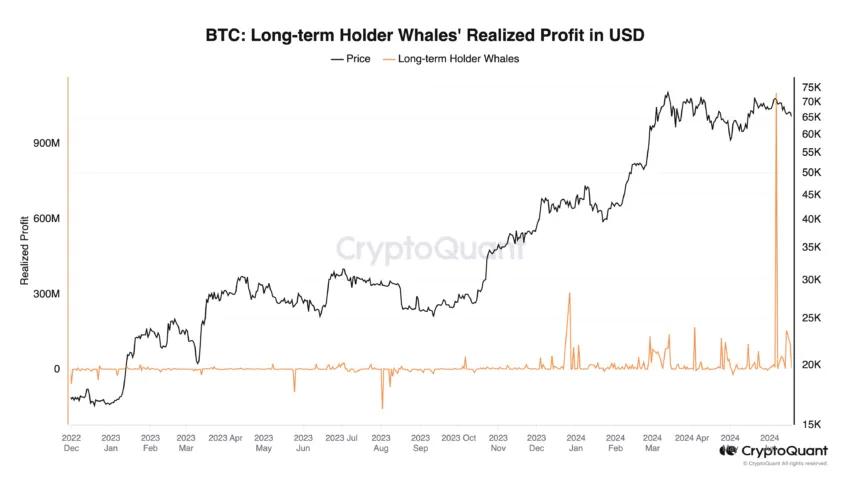
He warned that without adequate absorption, brokers might be compelled to transfer Bitcoin to exchanges, potentially leading to further market disruptions.
Adding to the market’s pressures, early Bitcoin miners have also played a notable role in the sell-off, having cashed out around $550 million in profits during a period when Bitcoin prices fluctuated between $62,000 and $70,000. This group’s actions have significantly amplified the downward pressure on Bitcoin’s pricing.
The timing of these sell-offs corresponds with a period of miner capitulation following the recent Bitcoin halving—an event that reduces the reward for mining new blocks and often results in the elimination of less efficient miners.
This halving has led to a temporary increase in Bitcoin being sold as exiting miners liquidate their holdings, typically causing a dip in Bitcoin’s value before a potential recovery.
On-chain analyst Willy Woo emphasized the need for a thorough clearing of open interest in the futures markets to pave the way for a resumption of bullish trends. He underscored the necessity for substantial liquidations before the market could stabilize and regain upward momentum.
Persistent Negative Net Flows in Bitcoin ETFs
Further complicating the landscape, the AI-driven analytics platform Spot on Chain reported persistent negative net flows in Bitcoin ETFs. As of June 18, 2024, there was a net outflow of $152 million from Bitcoin ETFs, marking a continuing trend with the total reaching $714 million over four consecutive days.
Notable institutions like Grayscale and Fidelity experienced significant outflows, which exacerbated the overall bearish sentiment in the market. Moreover, analysts at IntoTheBlock, a data science company, noted a spike in Bitcoin transactions earlier in the year, driven by heightened interest in ordinals and Runes.
However, despite increased usage and activity from large-scale holders, or “whales,” there has not been a corresponding increase in new participants entering the market.
IntoTheBlock analysts have observed that while bull markets in cryptocurrencies are typically driven by widespread enthusiasm for Bitcoin, the current situation is marked by a stark lack of growth in retail users.

The number of new Bitcoin users has fallen to a multi-year low, even lower than levels observed during the 2018 bear market, raising significant questions about the sustainability of the current market dynamics.
Despite these challenges, Ki Young Ju remarked that media sentiment towards Bitcoin remains largely bullish. However, he cautioned that this optimism might not necessarily translate into beneficial outcomes for the cryptocurrency.
Given the extensive sell-offs by long-term stakeholders, early miners, and the ongoing negative flows from BTC ETFs, Bitcoin may be poised for a prolonged period of correction as it struggles to stabilize and attract new retail interest amidst these turbulent market conditions.
Follow us on Google News
Get the latest crypto insights and updates.