Bitcoin Cash Price Analysis of February 28, 2025: Bulls Eye $291 While Bears Target $269
Dive into Bitcoin Cash Price Analysis on Feb 28 to understand BCH's market trends and investment potential in 2025
Author by
News Room

Dive into Bitcoin Cash Price Analysis on Feb 28 to understand BCH’s market trends and investment potential in 2025.The crypto market continues to face volatility, with bearish sentiment affecting several major coins. Bitcoin Cash’s recent actions are no exception, struggling to maintain stability. As selling pressure increases, BCH finds itself at a critical level, leaving traders wondering if this is just a temporary dip or the beginning of a deeper downtrend. Will buyers step in to reclaim lost ground, or is further downside ahead? Let’s dive into the latest Bitcoin Cash price movements and key technical levels.
BCH Price Analysis of February 27
The trading day started with a moderate range. Early in the session, at 1:10 UTC, a golden cross appeared on the MACD line, signaling the beginning of an upward trend. As shown in Chart 1, this shift in momentum pushed the price to an upward channel. By 6:40 UTC, the RSI showed an overbought, indicating strong buying pressure that pushed the price higher. This trend continued until 10:25 UTC, when the price again entered the overbought territory, facing resistance at $303.5. Unable to break past this level, the momentum weakened, and a sideways trading range formed around 14:55 UTC.
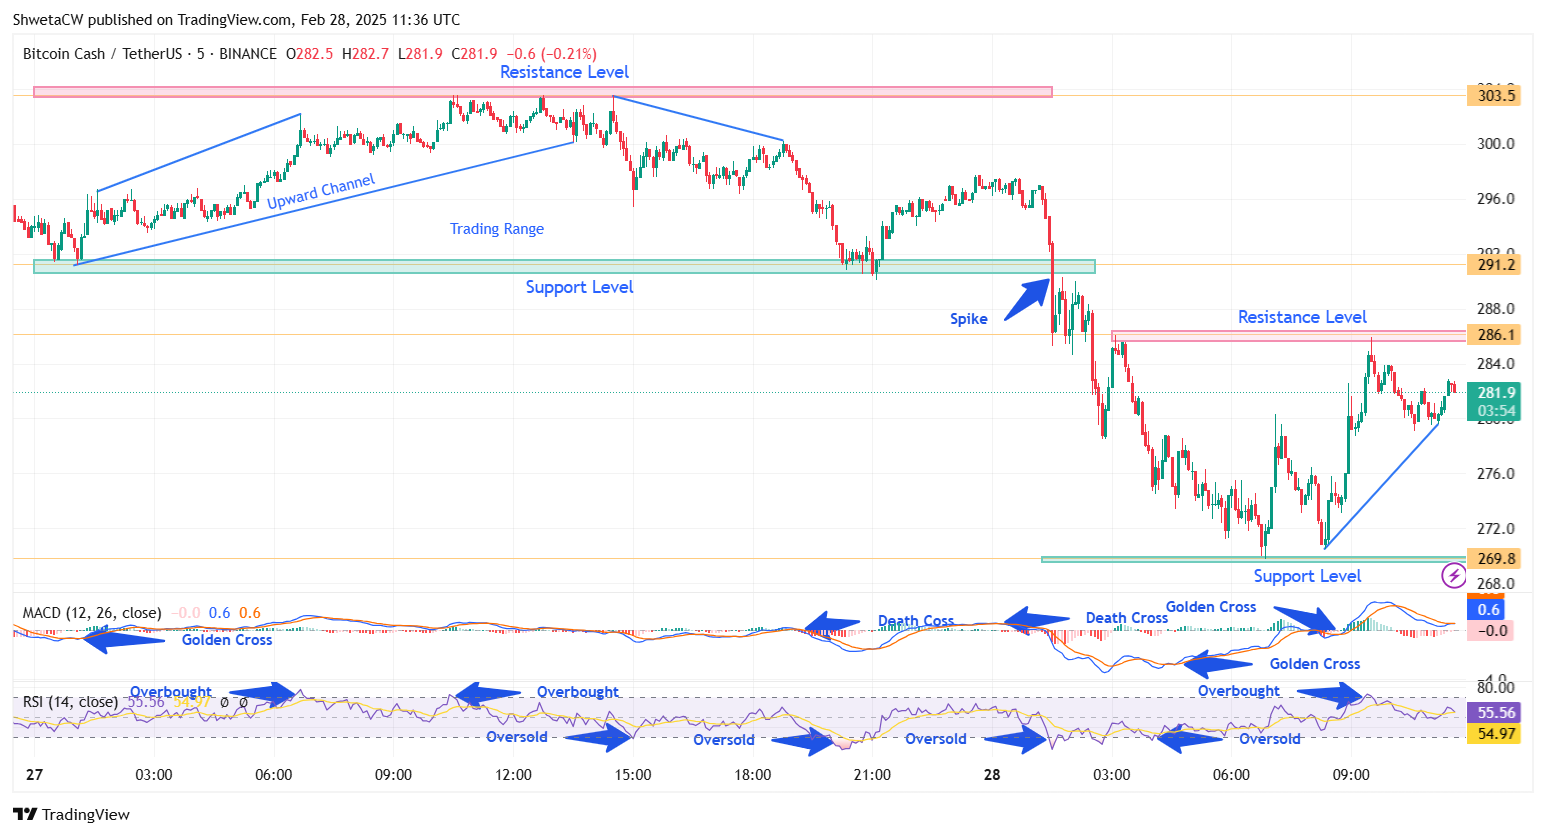
Chart 1, Analyzed by ShwetaCW, published on TradingView, February 28, 2025
As the day progressed, sellers began to take control. A critical moment came at 19:05 UTC when a death cross appeared on the MACD line, signaling a bearish reversal. This shift caused the Bitcoin Cash price to slide downward. An oversold condition occurred around the same time, further confirming the weakening momentum. Despite this, bulls made an attempt to regain control. At 21:05 UTC, another golden cross appeared on the MACD line, providing a push. This allowed the price to bounce back from its support level, preventing a deeper drop.
BCH Price Analysis on February 28
The trading session on February 28 began with a moderate trading range, showing signs of market indecision. However, by 1:15 UTC, a death cross appeared on the MACD line, initiating a downward channel. The bearish momentum strengthened as the price faced an oversold condition at 1:30 UTC, triggering a sharp spike before continuing its decline. As shown in Chart 1, an oversold condition at 2:45 UTC pushed the price down. However, buyers attempted to get control, leading the price to recover and set a new resistance level of $286.1. Despite the recovery, the price struggled to maintain its upward momentum, continuing its downward trend.
By 4:00 UTC, another oversold condition suggested weakness in the market, continuing the bearish trend. The turning point came about 8:45 UTC, when a golden cross appeared on the MACD line, signaling a potential price reversal. This shift in momentum triggered a powerful upward trend, restoring market confidence. At 9:25 UTC, an overbought indicator appeared, signaling a short-term Bitcoin Cash price increase. Following this, the price entered a moderate trading range with an upward tendency. That indicated that bullish sentiment was gradually getting stronger.
Bitcoin Cash Market Trends: A Critical Turning Point
The recent BCH price analysis highlights critical levels shaping its next move. If the bullish trend continues, the Bitcoin Cash latest price could break above the $286.1 resistance and head to the next key level at $291.2. Alternatively, if selling pressure increases, the price could fail to hold support at $269.8, potentially leading to further declines. Recent indicators have shown mixed signals, prompting traders to actively monitor key levels.

News Room
Editor
Newsroom is the editorial team of CoinfoMania, delivering 24/7 crypto news, market insights, and in-depth analysis. With 30+ journalists worldwide, we keep you ahead in the blockchain space.
Read more about News RoomRelated Posts

XRP Price Rockets to $2: Ripple– Cardano Partnership Sends XRP Soaring — What’s Really Going On?
News Room
Editor

Pi Price Surges 6.5% Today — Will Pi Network Hit $3 This April?
News Room
Editor

Ethereum Price Crashes 20% Overnight: Peter Schiff Warns of Fall Below $1,000
News Room
Editor
Loading more news...