


Bitcoin cash is seeing one of its biggest bullish performances. Over the last seven days, the coin surged by more than 100%.
One of the main highlights of this period happened on Wednesday. The altcoin kicked off trading at $110 and experienced a massive increase in buying volume. As a result, it flipped one level it hasn’t in more than thirty days.
The uptrend continued as the token made an attempt at the $140 resistance. However, it failed to break the highlighted mark as it faced strong rejection but briefly touched. Afterwards, it dropped to a close at $135; signifying a more than 23% positive change in value.
Friday was another key highlight of the week as BCH had a bigger surge than the previous. It started trading at $133, flipped several resistances as it surged. One such barrier is $160. The last time the asset under consideration broke this level was in July 2022. This time, it went a step further and attempted $200.
It failed in its first bid but recorded massive changes in price. Although it closed at $182, it gained more than 36%.
The $200 resistance crumbled under intense pressure the next day. It also attempted $210 but faced strong pushback. Nonetheless, the day ended with the asset exchanging at $212. This also signifies a more than 16% increase in value.
With these massive increases, indicators are diplaying mixed readings and speculations of what may take place in the next few days.
Bitcoin Cash is Overbought
Following price action on Wednesday, the Relative Strength Index shot past 70. The metric closed that session at 74 which meant the asset was overbought.
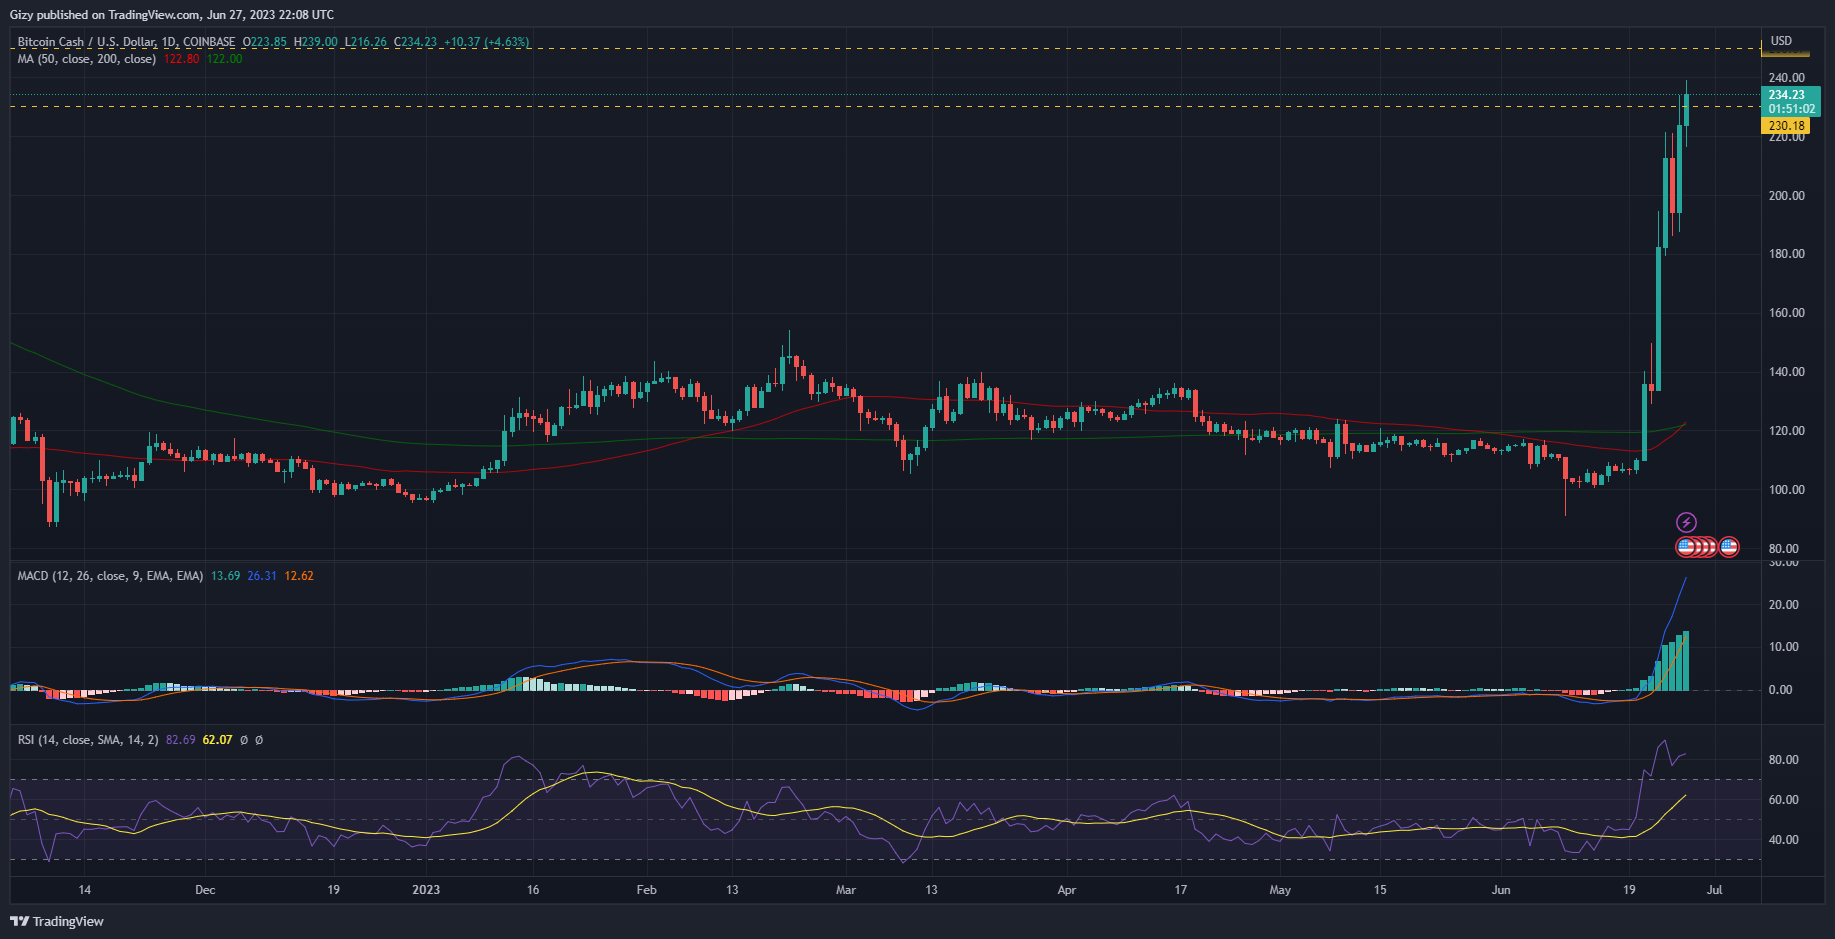
Over the next five days, BCH saw massive increase in buying that saw it maintained stability above 70 RSI. At the time of writing, the trend is still present.
This is a strong indication that the end of the current uptrend may be drawing close. A look at the chart suggest a sharp increase in selling pressure that saw the metric under consideration dropped a high of 89 to a low of 76. Although it is showing signs of recovery, the hike is not as rapid as the previous days.
While RSI hints at an impending correction, the Moving Average points to more price improvements.
BCH had a Golden Cross
The 50-day and 200-day MAs are the go to for predictions base on market trends. Both indicators suggest that the price increases may continue.
Both metrics intercepted in what many refer to as a golden cross. This phenomena preceeds a massive change in value.