


Bitcoin is on a rampage with little breaks. The current intraday session is no exception as the coin reclaimed another key level. This time it flipped the $28k resistance and peaked at $28,400.
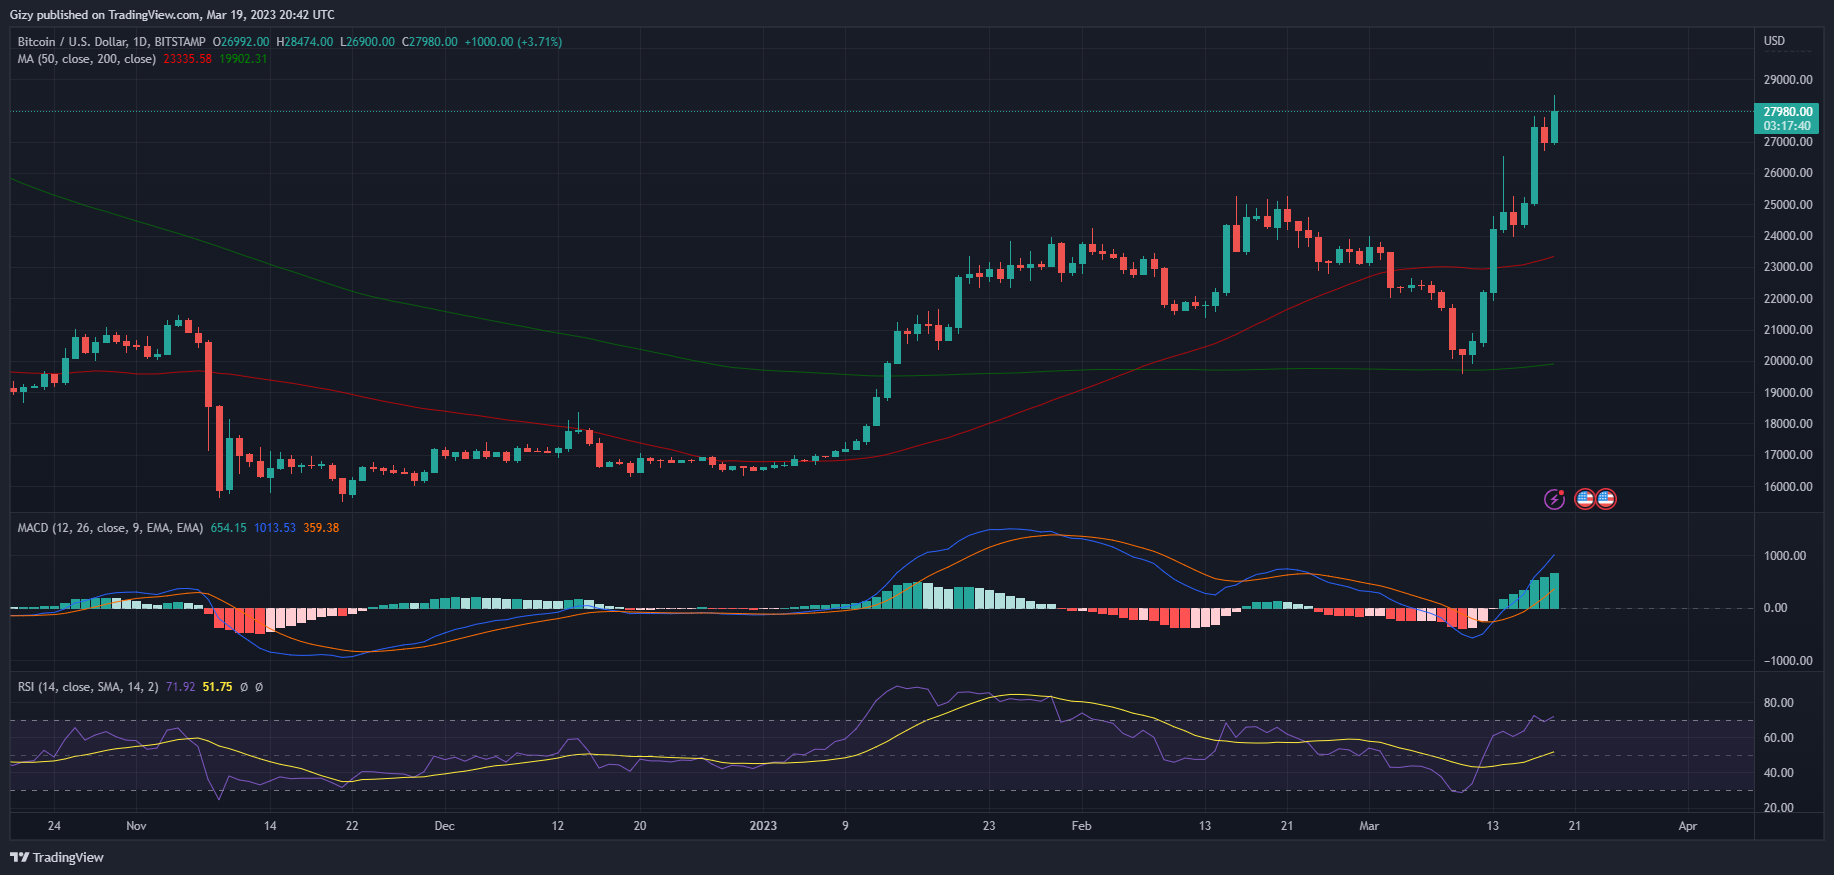
BTC opened trading at $26,992 and is currently holding on to the highlighted barrier amidst strong rejection at its peak. Nonetheless, the top asset added more than $1,000 to its value; representing a more than 4% increase. The latest improvement in prices had notable effects on the trajectory of most indicators.
The first to consider is the Relative Strength Index. A closer look at the chart above indicates that the largest cryptocurrency by market cap is overbought. It is currently above 70 and may surge high if the current uptrend persists.
Another metric to take into account is the Moving Average Convergence Divergence. Following the bullish divergence a few days back, the indicators as been on an uptrend surging above zero. This also translated to the Moving Averages as they slightly arched upwards.
How High Will Bitcoin go?
It is important to note that many may take RSI readings as a cue that the price increases are gradually coming to an end. However, current market trends do not support this conclusion.
Recall that a previous analysis pointed at a CME gap at $27k to $28k. If this holds, we may expect a retest of the $29,000 resistance before the uptrend comes to an end.