


Bitcoin and many other assets on the radar of most traders are seeing an impending bullish signal. They are all edging for a golden cross. The apex coin seems ahead as we noticed that both Moving Averages are closer.
As of the time of writing, the 50-day MA is at $19,724 and the 200-day sits at $19,314. At the current rate of attraction, we may expect both metrics to intercept within the next fourteen days. Does that mean the most anticipated correction will never come if this happens?
Will Bitcoin Break the Trend?
On previous occasions, the sign of new bullish period was a massive dip to levels not seen in a while. Many may argue that the apex coin dipped to a low of $15k, that should be enough. Analysts believe this is not the case and based on previous cycles, a drop to $10k is inevitable.
A golden cross is an event that signifies the start of a bullish round or run. With BTC exchanging at $23k, many expect that a cross at this point could annul the predictions of a drop to $10k. It is important to go back to price movements to understand what could happen.
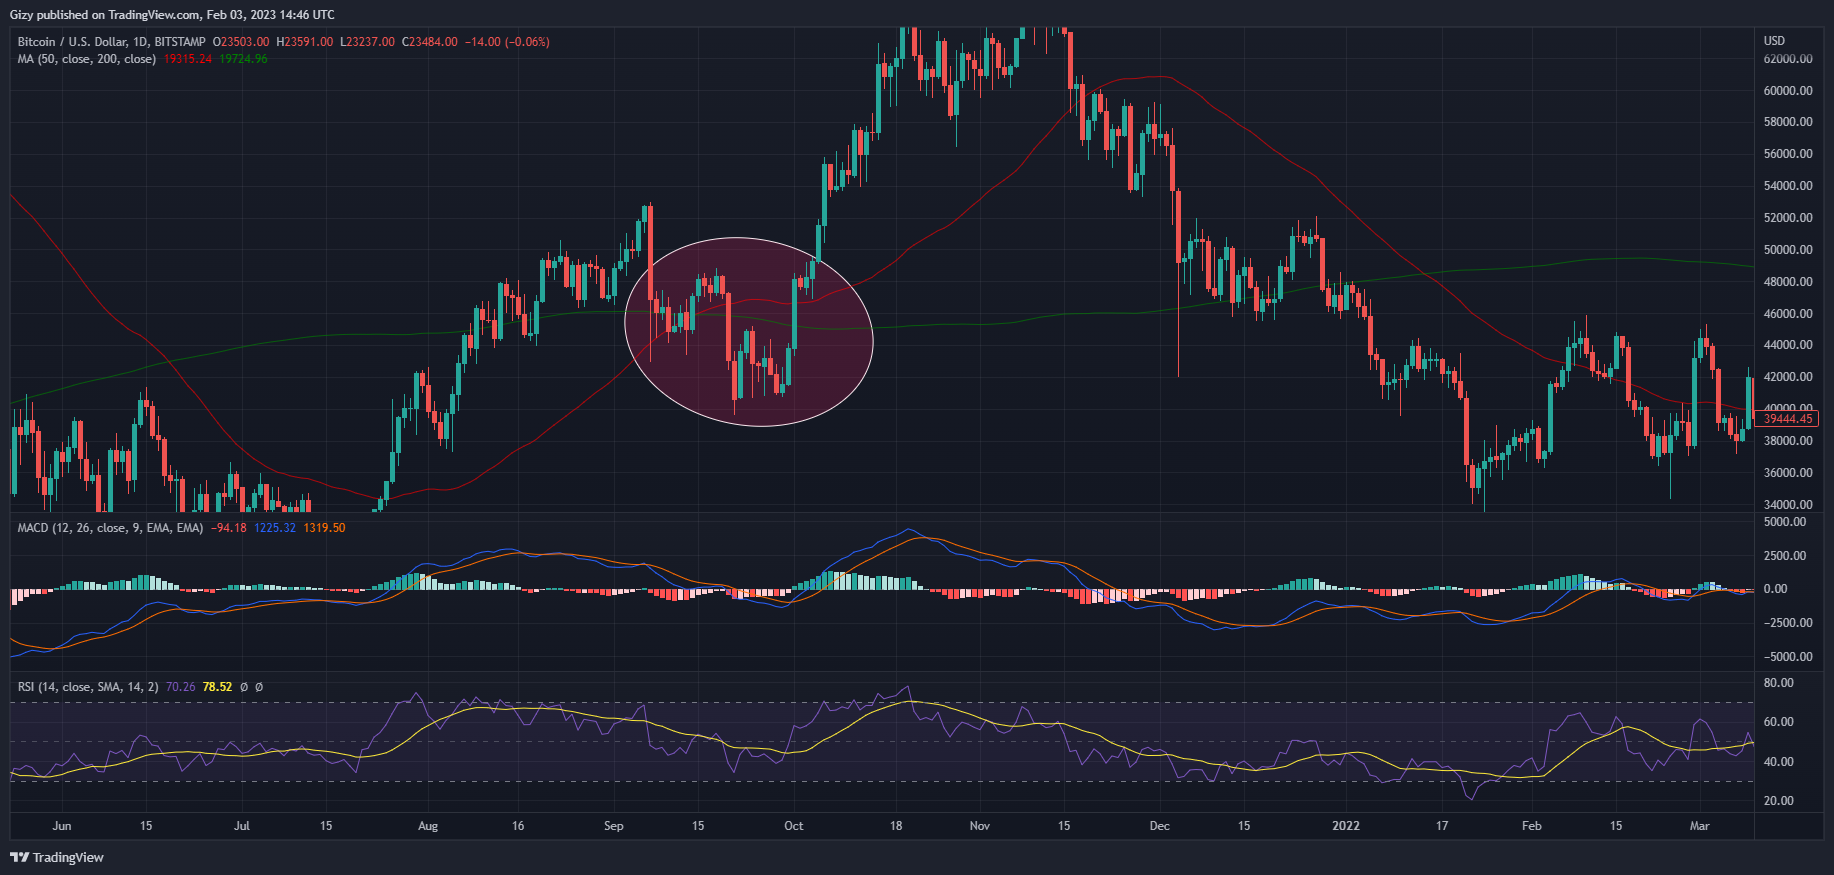
The chart above has an eclipse area. This was where the previous positive interception took place. We noticed that after the cross, retraced to its 30-day low before the main uptrend. The same may take place this time. How low will it go?
BTC Taste $24k
The apex coin was also on an uptrend during the previous intraday session. As a result, it tested and flipped $24k. BTC peaked at $24,528. However, it retraced as the bulls could not sustain the momentum. As a result, the largest cryptocurrency closed a little below its open.

While many traders are looking forward more price increases, current price movement suggest that bitcoin may be gearing up for price decreases. The previous day’s candle was a red hammer. Candlestick patterns suggest more red candles ahead.