AVAX Price Analysis of March 12, 2025: AVAX Bounces Back from $15.50, Are Bulls Targeting to Break $18 Next?
Let’s dive into the latest AVAX price analysis of March 12, 2025, featuring key support and resistance levels along with technical indicators and potential breakout scenarios.

Are you thinking of investing in Avalanche? The AVAX price analysis will definitely help find the best trends with minimal risk. As of March 12, 2025, the AVAX price today in the 5-minute price chart highlights crucial support and resistance levels, along with significant trading signals based on MACD and RSI indicators. These insights can help traders understand price movements, potential breakout points, and trend reversals for better decision-making.
AVAX Price Analysis: Key Support and Resistance Levels
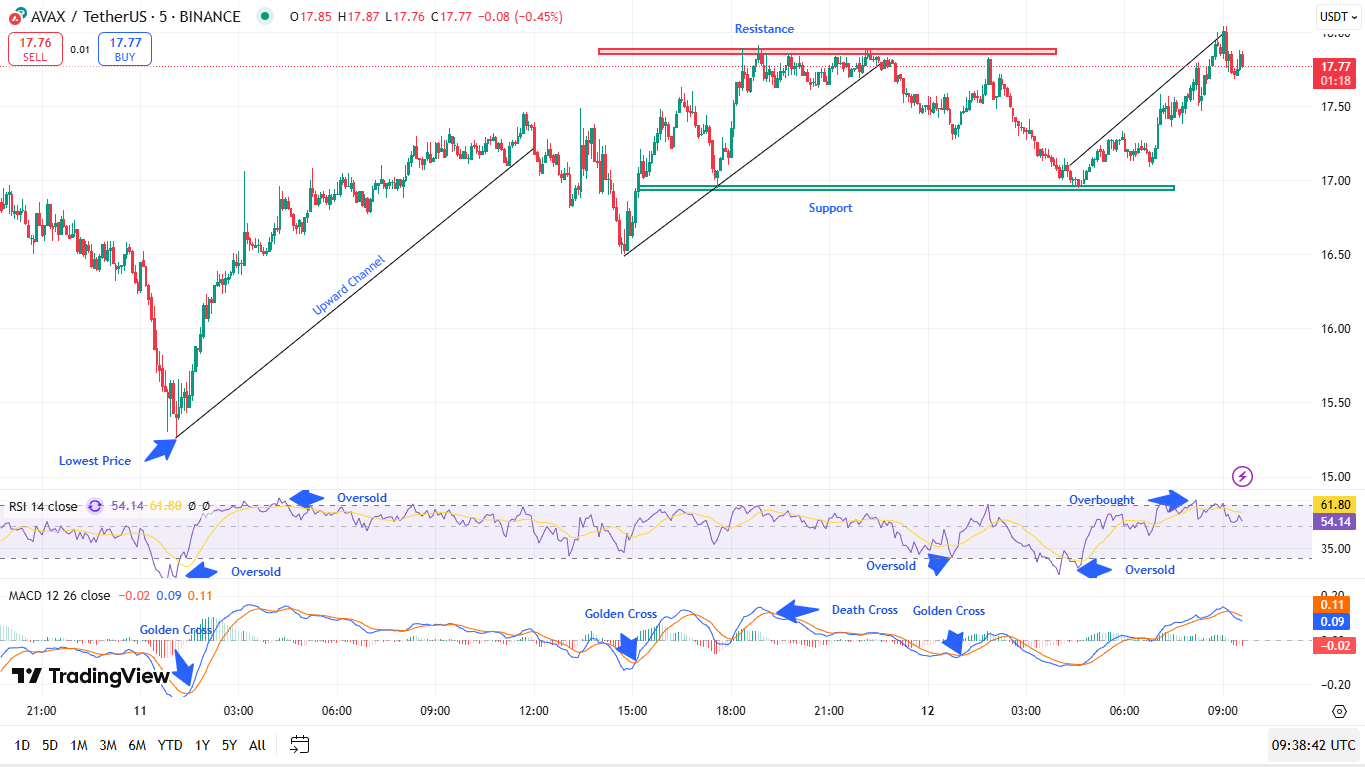
During this session, the strongest support occurred when prices dipped to $15.50 and this kept prices from falling any lower. A recovery process began for AVAX once it reached its lowest point before it established an upward channel pattern. Market participants opposed the price movement at $18.00 through repeated selling attempts. This critical barrier functioned as an essential limit that forced additional upward price advancement until traders attempted to break it.
Analyzed by baishnabtriparna, Published on Tradingview on March 12, 2025
The price support at $17.00 established itself as a valuable area where traders typically initiated new buying positions. The price level at $17.00 demonstrated its vital role in the market by rejecting downward pressure when AVAX interacted with it several times.
AVAX Price Today: Bullish and Bearish Trend Reversals
The price of AVAX experienced a bullish breakout by moving above the $17.50 resistance level following the formation of a MACD Golden Cross and rising RSI metric values. The market experienced a lasting upward movement toward $18.00, but the price encountered significant resistance at that level. When AVAX dropped below $17.50, the market generated a confirmed shift in its momentum. An indicator of deteriorating bullish strength emerged after a MACD Death Cross pattern appeared. The price found brief support at $17.00 before its recovery started.
AVAX price trend: MACD and RSI Trading Signals
Traders gained important price movement information through the combined application of MACD and RSI trading signals in AVAX. The price displayed two MACD Golden Crosses during its uptrend which guaranteed powerful bullish momentum and ensured market expansion through time. A MACD Death Cross emerged as AVAX neared the $18.00 resistance threshold, indicating that upward momentum would decrease and a price adjustment might take place.
The RSI analysis combined with price movements to support indicator signals which revealed possible trend reversals based on the $15.50 oversold zone and the $18.00 overbought zone. The resource spent time in extremely bearish positions, leading to price rebounds that started at $17.00, building strong demand for purchases.
AVAX Price Analysis: Best Possible Trading Strategies
Multiple profitable trading strategies would have been feasible based on the available market signals. The AVAX price Tenant Position strategy was suitable for purchases at $15.50 because RSI moved out of oversold levels, and a MACD confirmed positive trends for bulls. The $17.00 support established itself during a new entry point when investors increased their interest in the market. Investors who took a short position on AVAX encountered profitable opportunities at $18.00 after RSI crossed overbought levels while a MACD Death Cross warned of a reversal.
AVAX experienced accelerating selling pressure that announced a market direction change after it fell past $17.50. The $17.00 – $18.00 range that traders monitored throughout presented numerous entry and exit points since they could acquire at support levels and exit at resistance levels. Traders could achieve successful, profitable transactions before a price breakout by taking advantage of the established boundary box.
AVAX Price Trend: Hinges on Support? What’s Next?
AVAX showed multiple trading opportunities for 5-minute intervals because its chart contained a clear support level at $17.00 and resistance at $18.00. The RSI furnished clear alerts regarding both oversold and overbought periods as part of the technical analysis system, which included MACD Golden Cross and Death Cross indicators. By integrating support-resistance levels with MACD trends and RSI movements, traders could have developed better entry and exit approaches for their trades. Future price effectiveness for AVAX requires continued monitoring of these important indicators.
Follow us on Google News
Get the latest crypto insights and updates.