Avalanche Price Drops 20%: Technical Indicators Confirmed Breakout at $22.86 Led to a Bearish Momentum
Let’s delve into the market scenario of AVAX on March 4, 2025, indicating an Avalanche price drop and understand the future prospects of this coin.
Author by
Wilfred Michael

Are you looking to invest in Avalanche The AVAX price chart on Binance, analyzed in the 5-minute timeframe, showcases a structured price movement with a strong downward trend followed by a consolidation phase. Initially, AVAX reached a peak price of approximately $24.50 before reversing into a sharp downtrend. The price decline started around 14:30 UTC where it tested the resistance level near $24.50 and failed to sustain upward momentum. This failure marked the beginning of a steady decline, which led the price to establish consecutive lower highs and lower lows.
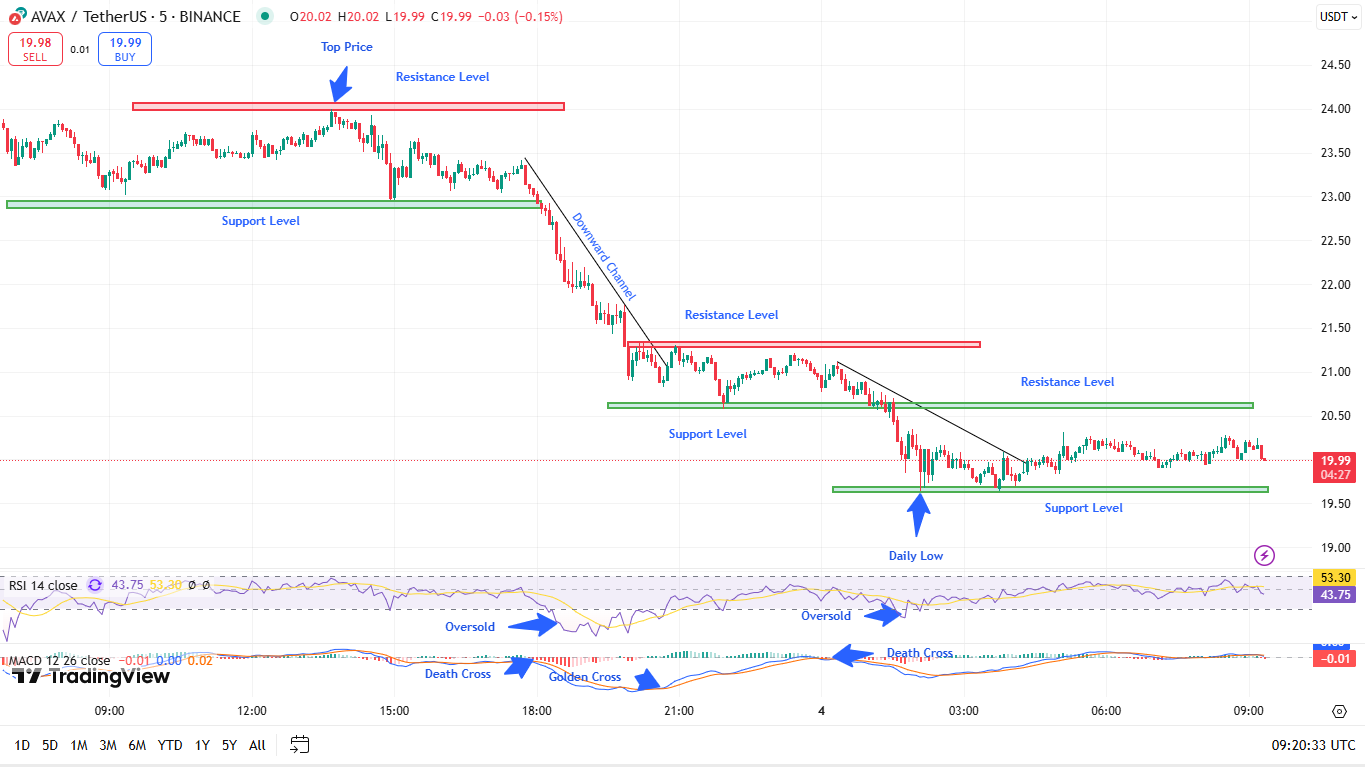
Analyzed by baishnabtriparna, published on TradingView on March 4, 2025
The support levels fell one after another and this trend became observable when Avalanche price dropped through it. At 18:00 UTC, the price reached $22.00 to examine an essential support zone. AVAX failed to hold onto its previous support level when selling pressure increased, so it broke through and fell further. Periodically, throughout UTC time 19:00, the price reached the critical support point at $21.50, yet bearish forces prevented the price from rising. The price formed a resistance at $21.50 but failed multiple recovery attempts that sent prices even lower.
The AVAX price trend reached its daily minimum at $20.00 during UTC time 21:00 while it corresponded precisely with the previously analyzed support area. The trading level tried to protest before another price decline occurred which forced the rate toward its daily low of $19.50 UTC between 03:00. Market stabilization occurred after crossing this production minimum when investors started buying at this specific support point.
Technical Indicators Confirming the Trend in AVAX Analysis
During the downtrend phase the Relative Strength Index (RSI) indicator effectively detected points when the market became oversold. The Relative Strength Index indicator maintained levels between 50-55 points when the AVAX price trend surpassed $22.00, which indicated market neutrality. RSI registered a dramatic decrease after the price drop, reaching 18:00 UTC when it fell beneath 30, which pointed to oversold conditions because the value approached $21.50. The price reached $20.00 at 21:00 UTC when RSI recorded its second oversold reading with a value of 25.
The Moving Average Convergence Divergence indicator depicted bearish power across its entire display duration. The declining trend after the Avalanche price drop was further strengthened by a death cross around 17:30 UTC as the cryptocurrency dropped below $22.00. A second death cross occurred at 21:30 UTC, which drove the price under $20.00. The bullish momentary indicator known as the golden cross happened at 21:00 UTC as AVAX tried to bounce near $20.00 before weakness in market conditions triggered a swift downward price trend.
The AVAX analysis suggests establishing multiple support and resistance levels, which played a critical role in determining price reactions. The resistance levels were established at $24.50, $21.50, and $20.50, while the support levels were established at $22.00, $21.50, $20.00, and $19.50. These levels were repeatedly tested and retested, shaping the trend and providing insight into market sentiment.
Future Prospects of Avalanche
The AVAX price trend strongly followed an evident downward tendency which created successively declining peaks and valleys. The price dropped from $24.50 to $19.50 in less than a few hours as it broke through multiple support points. The bearish trend was verified through RSI and MACD indicators as RSI went beneath 30 on multiple occasions while MACD produced multiple death crosses in sequence. The current price ranges between $19.50-$20.50, pointing towards an accumulation pattern. A potential recovery requires traders to watch for price crossing above $20.50 whereas more declines will occur if price breaks below $19.50.

Related Posts

Crypto Market News: Bitwise Lists Four Crypto ETPs on London Stock Exchange
News Room
Editor

Crack the Code, Win 1 BTC: Project 11 Tests Bitcoin’s Quantum Resilience
News Room
Editor

Ethereum Price Prediction: ETH Battles to Hold $1,560 Support: Will Upcoming Upgrades Propel It to $1,700?
News Room
Editor
Loading more news...