Avalanche Price Analysis of March 5, 2025: AVAX Shattered the $21 Resistances Level Strongly, Will This Uptrend Continue?
Let’s dive into the Avalanche price analysis and find out if it can sustain above $21.00. Read about the latest insights and price predictions.
Author by
Coinfomania News Room

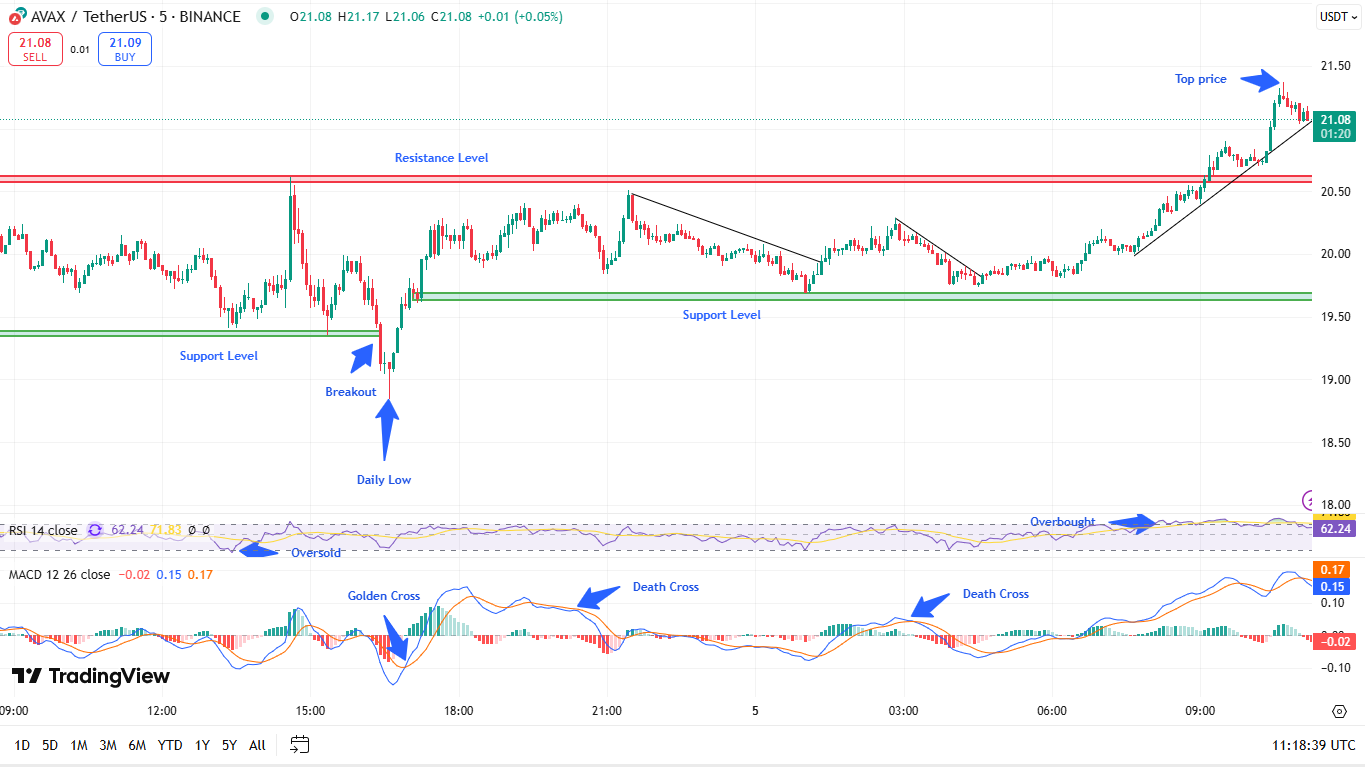
Are you thinking of investing in AVAX and willing to be backed up with the Avalanche price analysis for today? The AVAX price today on Binance presents a clear picture of price movements, key technical indicators, and market psychology to back up an investment decision. The support at $19.50 acted as a pivotal barrier that stopped the additional price decrease during the session. The resistance point at $20.50 proved very resistant to price movement until the price successfully broke through it to rise toward $21.50, which became the session high.
To understand momentum shifts and identify price reversal possibilities in Binance charts, the AVAX price today must examine the Relative Strength Index (RSI) together with the Moving Average Convergence Divergence (MACD). These trading signals helped investors make successful trades through golden crosses and death crosses as well as overbought/oversold readings.
Analyzed by baishnabtriparna, Published on TradingView on March 5, 2025
Avalanche Price Analysis: Breakout and Price Movements
The trading day opened with AVAX price movement occurring throughout the consolidation range, spanning from support to resistance. A significant buying pressure developed at $19.50 when the price reached its lowest point for the day. After which, there was a swift AVAX uptrend observed in the chart.
The cryptocurrency established higher highs which eventually led to its ascension toward reaching $20.50 as its resistance threshold. When the support line was crossed by intense market pressure, the price exceeded both levels until reaching the session’s high at $21.50. The price chart demonstrates a changing market direction because AVAX formed an upside trend from its support zone.
Indicators Align: RSI and MACD Validate AVAX’s Bullish Trend
Momentum analysis in this study heavily depends on the RSI as a key indicator. The RSI indicator entered the oversold area after AVAX reached its daily bottom point which implied a market recovery because sellers were starting to lose their momentum. The oversold situation in the market pushed investors to return, which fueled the price increase. The rise of AVAX held the RSI within the overbought area, thus implying possible exhaustion of buying momentum. The market experienced brief stabilization, which allowed prices to settle around $21.50 before continuing their direction.
The trend changes notated in the chart received backing from the MACD indicator. A golden cross between the MACD line and signal line emerged right after the breakout and validated the bullish price change. The price then encountered two death crosses during that time frame, which suggested short periods of declining market strength. Likewise, the price undergoes brief pauses before it starts to proceed in its trend direction after such crossing events.
AVAX Price Behavior: The Role of Support and Resistance
The price behavior of AVAX was fundamentally influenced by the positions of both support and resistance lines. Between $19.50 and $19.80, the support function operated as a crucial demand area, which served to stop the price decrease and trigger the breakout. The resistance level at $20.50 initiated the AVAX upward before intensive buying activities finally surged AVAX past the barrier, thus setting off an extensive positive price shift. During the session, the price achieved its peak value at $21.50 yet it shortly retreated after hitting that point. The AVAX price shows consolidation at $21.08 and might form new support levels while retracing to lower areas before performing another breakout attempt.
AVAX Price Forecast: Further Gains Ahead
The AVAX/USDT pair experienced powerful upward momentum through its support level recovery combined with breaking resistance barriers. наприous reversal points were validated by RSI indicators and MACD, which gave traders valuable opportunities to trade price changes. Further price increases should extend to $22.00-$22.50 as long as AVAX continues sustaining its position above $21.00. If a rejection takes place around the $21.50 zone, the price might begin retracing towards $20.50 or a lower value. The technical indicators look positive, but investors need to track changes in RSI metrics, and MACD crosses for any upcoming shifts in the market.

Coinfomania News Room
Author
Newsroom is the editorial team of CoinfoMania, delivering 24/7 crypto news, market insights, and in-depth analysis. With 30+ journalists worldwide, we keep you ahead in the blockchain space.
Read more about Coinfomania News RoomRelated Posts

SHIB Price Recovers From $0.00001280 as Market Momentum Shifts
Buvaneswari
Author

Sui Network Gains Institutional Traction as Fireblocks Enables Secure Custody and DeFi Access
Sajjad
Author

Bittensor’s TAO Token Gains Wider Accessibility Through Luno Listing in High-Growth Markets
Sajjad
Author
Loading more news...