ADA Price Analysis of March 12, 2025: Cardano Fluctuates Between $0.70 and $0.75 Levels, Is a Breakout Ahead?
Let’s delve into the latest ADA price analysis of March 12, 2025, featuring key support and resistance levels, trend analysis, and more.

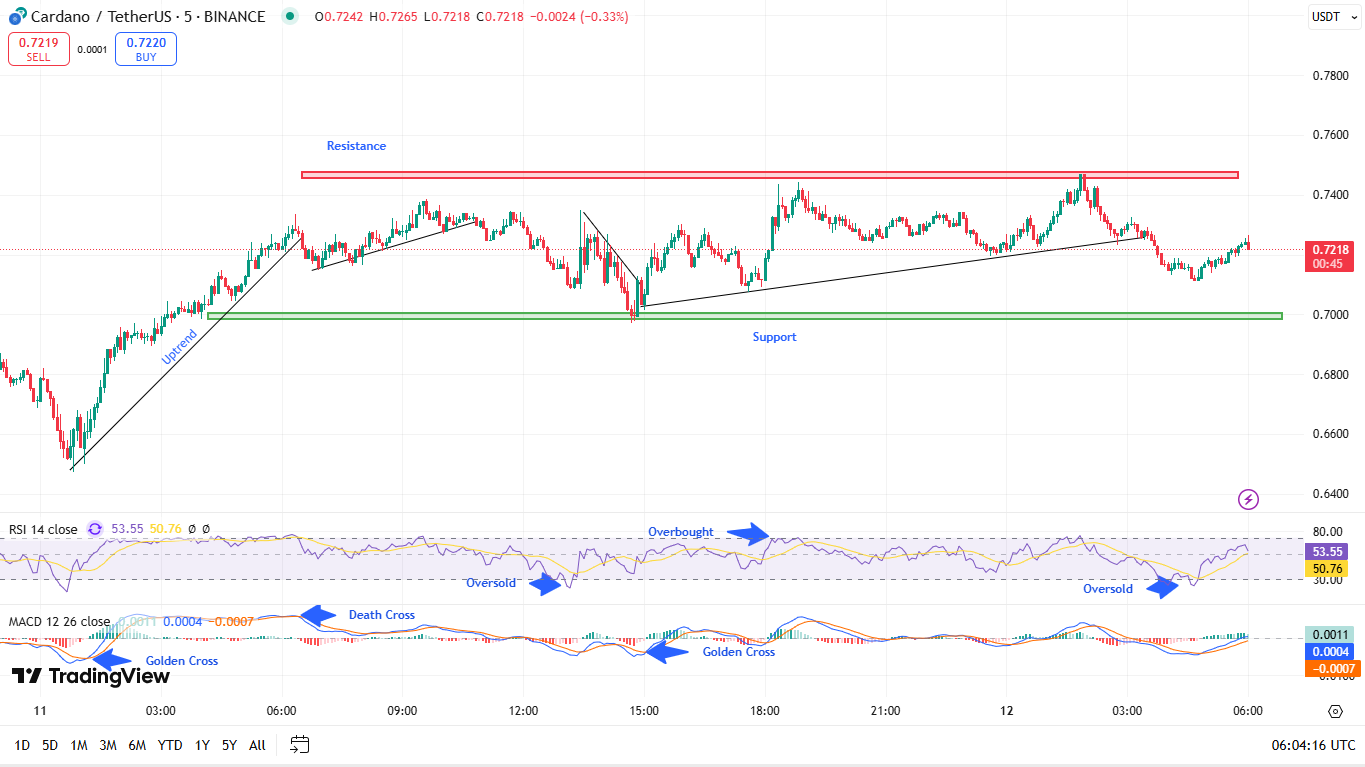
Are you thinking of investing in Cardano and looking for the ADA price analysis to set your limits? As of March 12, 2025, the trading activity of ADA took place within an established quadrant between support and resistance areas. The price recovered from the support level multiple times when reaching $0.7000. The ADA price encounters resistance at $0.7400 which functions as an important closing mechanism against upward price advances. ADA may initiate a bullish continuation when it crosses above the resistance mark yet bearish moves would become likely after a drop below support.
Analyzed by baishnabtriarna, published on TradingView on March 12, 2025
Cardano Price Prediction with Trend Analysis and Market Structure
The price started with an upward movement, producing successively higher high points and successively higher low points. Based on ADA price analysis, Cardano began a period of price consolidation after getting close to the resistance barrier, which showed market uncertainty. The market has been establishing potential ascending triangle patterns through black trendlines that identify higher lows, which frequently indicate bullish continuation signals. The ADA price analysis suggests that the breakdown of this pattern offers a risk of price reductions at its support level.
ADA Price Today: MCAD and RSI Indicators
During the price movement, the Relative Strength Index hovered between areas that were both overbought and oversold. During these specific periods, the RSI marker exceeded 70 points, which revealed that prices had become too expensive; thus, sellers entered and forced prices to decline. RSI fell briefly below 30 points, thus demonstrating oversold market conditions that resulted in price rebounds. The current RSI reading indicates 50-55, which shows neutral market momentum, thus indicating that the market could go either way.
Moving Average Convergence Divergence indicator reveals changes in overall market trends through its crossover patterns. The Golden Cross pattern in the MACD signal indicated an approaching uptrend because the MACD line surpassed the signal line. The MACD indicator displayed a Death Cross as it moved beneath the signal line to show a negative market direction. A new Golden Cross pattern appears to develop at the current time period and represents an ascending price trend, provided this trend continues to form.
A sustained move above the $0.7400 ADA price level will trigger a bullish breakout that may reach the $0.7500-$0.7600 areas, provided that RSI shows rising momentum and another MACD Golden Cross forms. A break below $0.7000 from ADA, while it fails to maintain a position above the black trendline, would produce a bearish breakout that might drive the price to drop toward $0.6800 or beyond. The currency shows consolidation when it stays inside the $0.7000 and $0.7400 range, allowing traders to purchase at support levels and sell at resistance until a strong breakout happens.
ADA’s Price Movement Hinges on Resistance Breakout: What’s Next for Cardano Price Prediction?
A buy order for ADA becomes favorable when it breaks past $0.7400 with a strong trading volume because this indicates a bullish trend. The trader should enter a short trade when ADA suffers resistance rejection, and the MACD indicator shows bearish crossover signals. An effective range-trading method includes buying ADA close to $0.7000 support levels and selling at $0.7400 resistance points before waiting for a definitive price movement.
The ADA price today presents itself as an essential price point as it stabilizes between important support and resistance levels. Additional confirmations are necessary to establish a neutral to bullish trading outlook according to MACD along with RSI indicators. The cryptocurrency will proceed towards additional upward potential when it successfully passes through the resistance barrier at $0.7400. A fall under $0.7000 would create a bearish price movement. Traders need to examine both trading volume indicators and essential analytical signals before opening any transactions.
Follow us on Google News
Get the latest crypto insights and updates.